IDI1
[ENSRNOP00000022389]
Main page
| | | Plot |
Mito |
Lyso |
|
Perox |
ER |
Golgi |
PM |
Cytosol |
Nucleus |
|
| Expt A |
 7
7
peptides |
19
spectra |
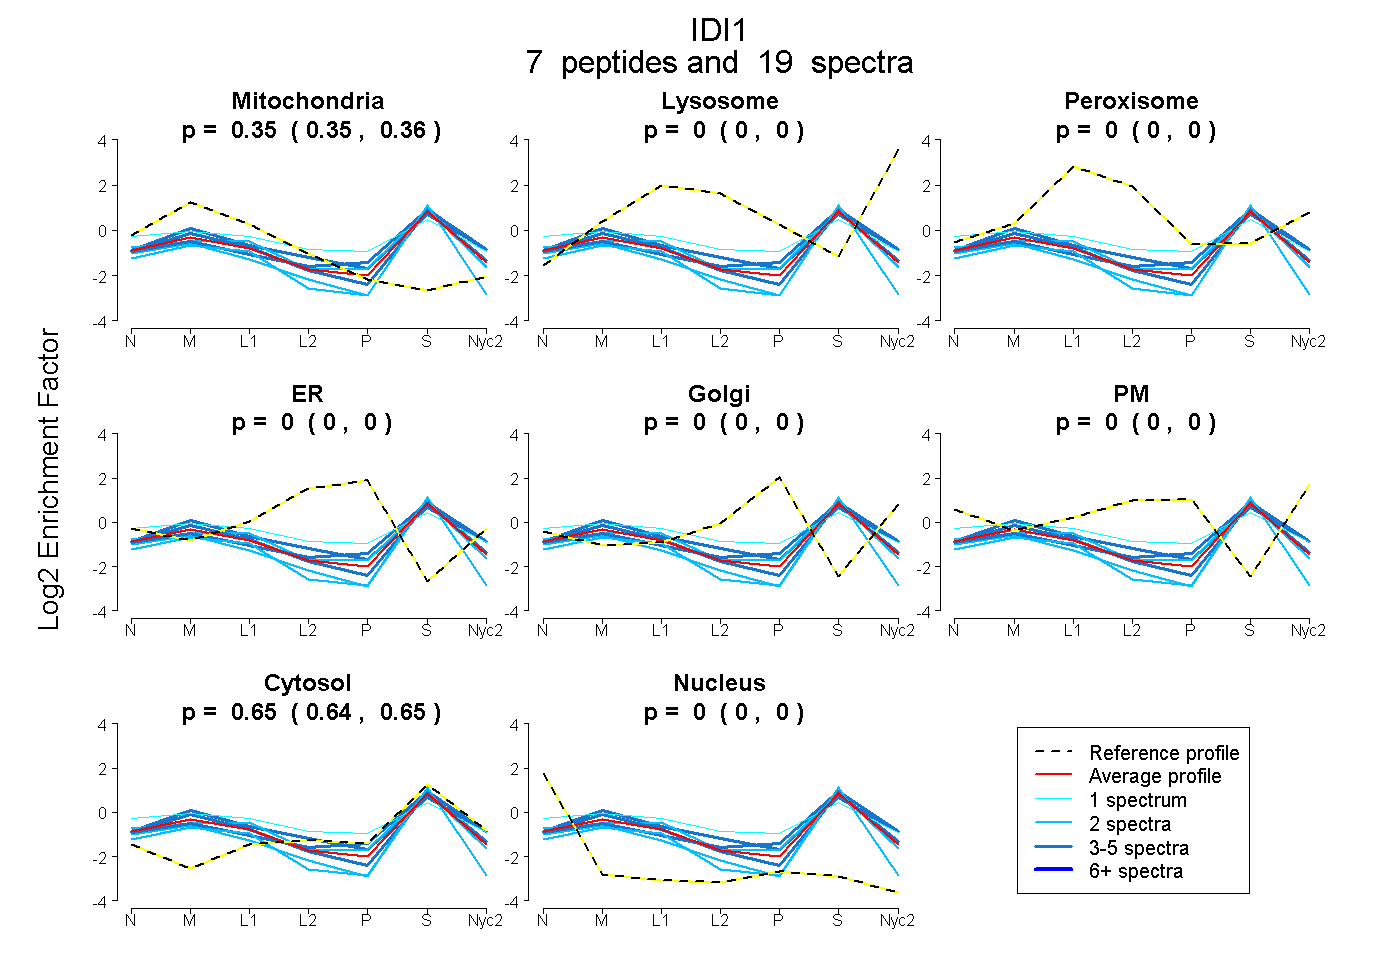 |
0.355
0.346 | 0.362 |
0.000
0.000 | 0.000 |
|
0.000
0.000 | 0.000 |
0.000
0.000 | 0.000 |
0.000
0.000 | 0.000 |
0.000
0.000 | 0.000 |
0.645
0.637 | 0.652 |
0.000
0.000 | 0.000 |
|
| | | Plot |
Mito |
|
Lyso or Perox |
|
ER |
Golgi |
PM |
Cytosol |
Nucleus |
|
| Expt B |
5
peptides |
13
spectra |
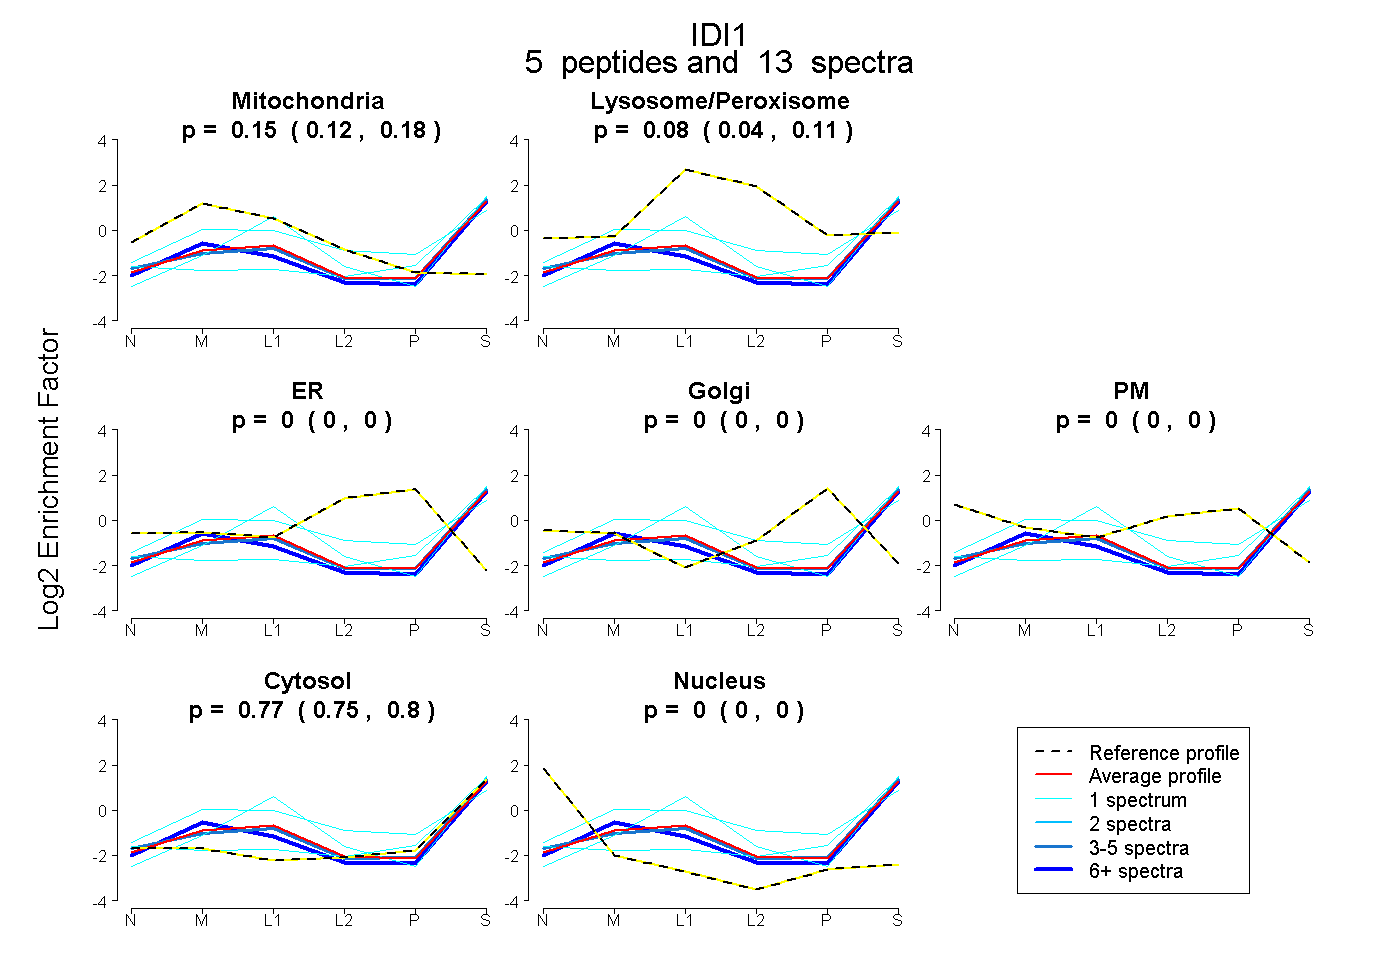 |
0.149
0.119 | 0.178 |
|
0.077
0.041 | 0.106 |
|
0.000
0.000 | 0.000 |
0.000
0.000 | 0.000 |
0.000
0.000 | 0.000 |
0.774
0.746 | 0.797 |
0.000
0.000 | 0.000 |
|
| 6 spectra, AFSVFLFNTENK |
0.199 |
|
0.000 |
|
0.000 |
0.000 |
0.000 |
0.801 |
0.000 |
|
| 1 spectrum, PEINASNLDEK |
0.000 |
|
0.058 |
|
0.000 |
0.000 |
0.000 |
0.942 |
0.000 |
|
| 4 spectra, IIADAFLFK |
0.129 |
|
0.069 |
|
0.000 |
0.000 |
0.000 |
0.802 |
0.000 |
|
| 1 spectrum, NVTLNPDPNEIK |
0.191 |
|
0.302 |
|
0.000 |
0.000 |
0.000 |
0.507 |
0.000 |
|
| 1 spectrum, NCHLNENIDK |
0.026 |
|
0.279 |
|
0.000 |
0.000 |
0.000 |
0.695 |
0.000 |
|
| | | Plot |
|
Lyso |
|
|
|
|
|
|
|
Other |
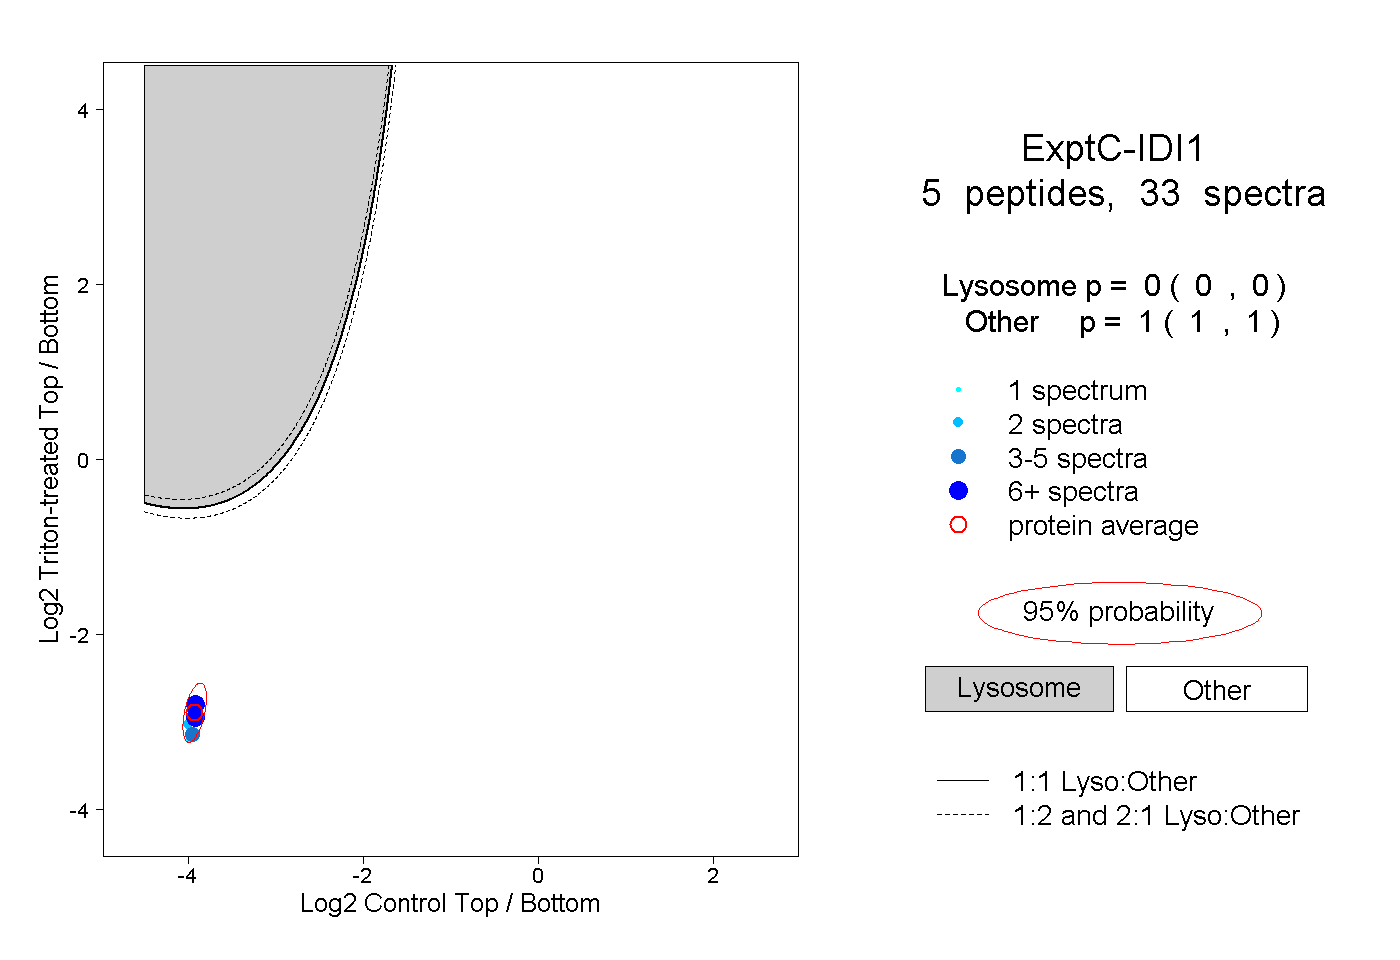
| Expt C |
5
peptides |
33
spectra |
 |
|
0.000
0.000 | 0.000 |
|
|
|
|
|
|
|
1.000
1.000 | 1.000 |
| | | Plot |
|
Lyso |
|
|
|
|
|
|
|
Other |
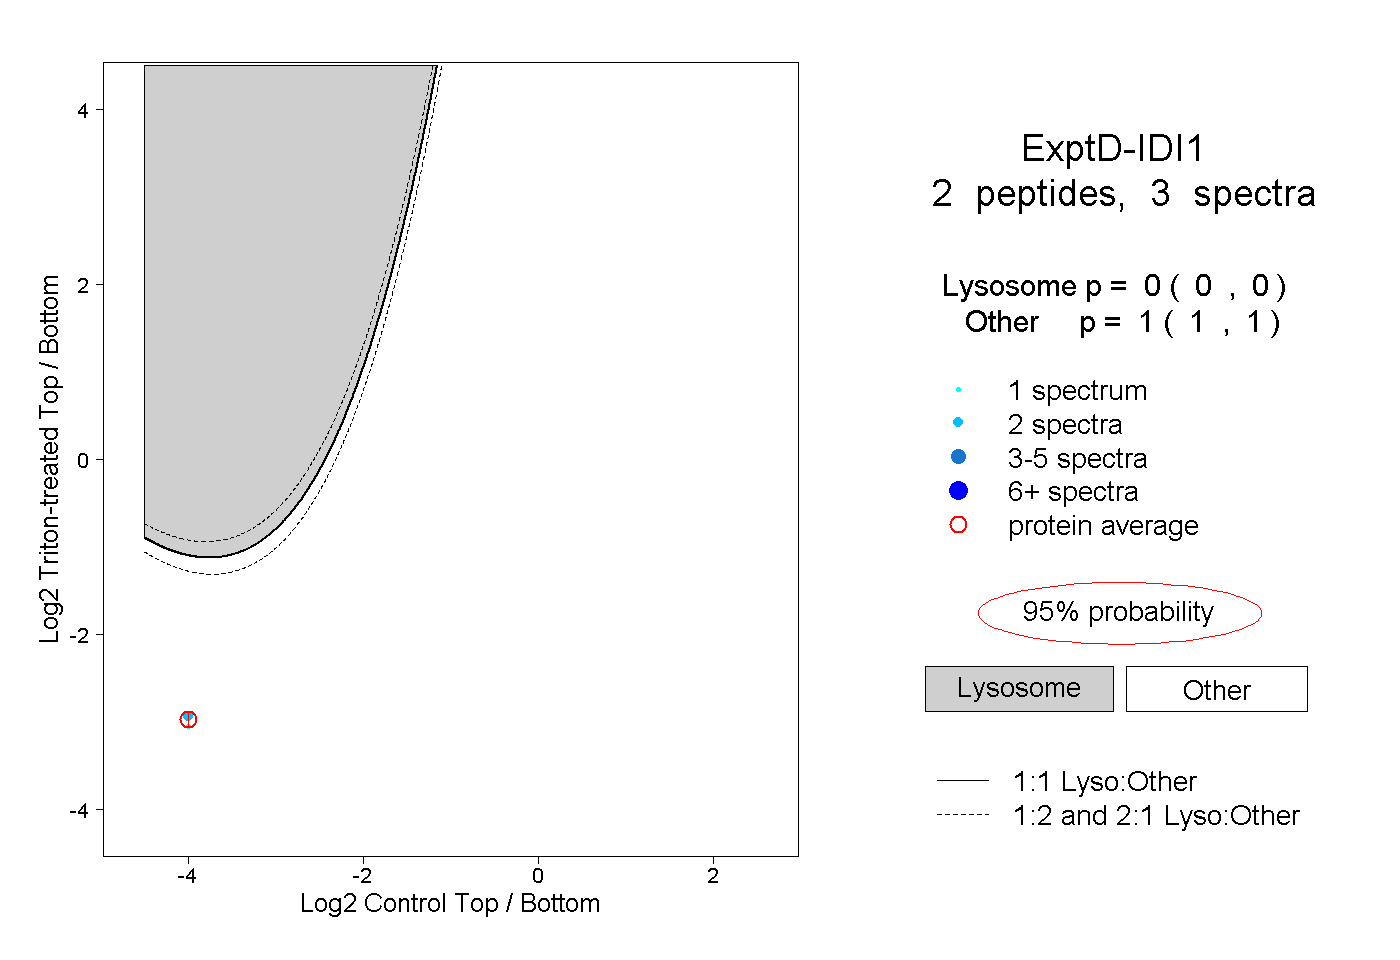
| Expt D |
2
peptides |
3
spectra |
 |
|
0.000
0.000 | 0.000 |
|
|
|
|
|
|
|
1.000
1.000 | 1.000 |