 6
6peptides
spectra
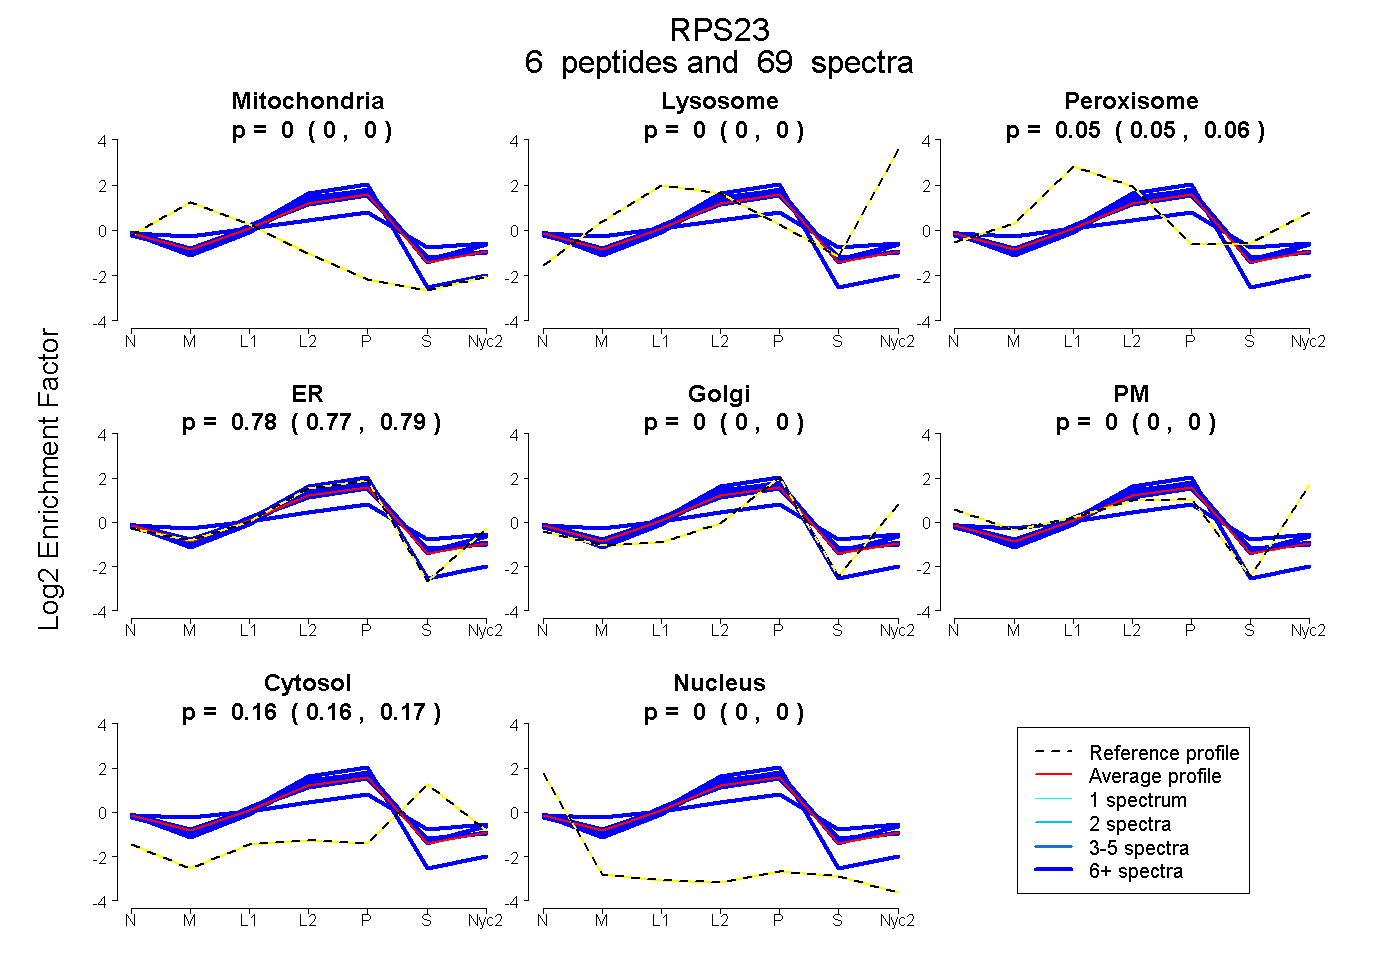
0.000 | 0.000
0.000 | 0.000
0.048 | 0.060
0.774 | 0.792
0.000 | 0.000
0.000 | 0.000
0.156 | 0.167
0.000 | 0.000
6peptides
spectra
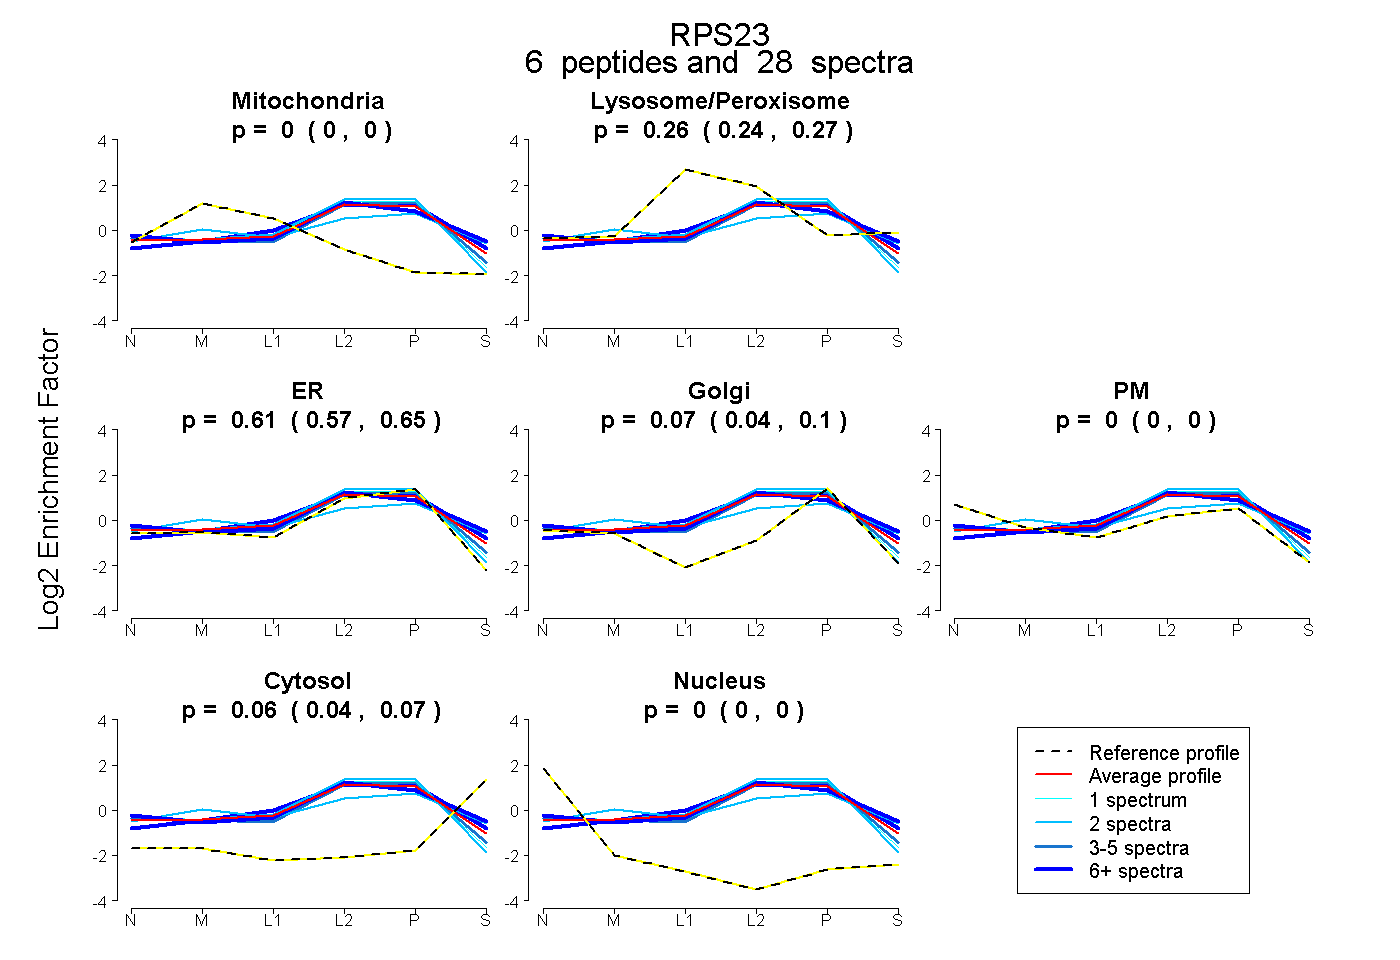
0.000 | 0.000
0.244 | 0.274
0.575 | 0.647
0.039 | 0.097
0.000 | 0.000
0.043 | 0.066
0.000 | 0.000
6peptides
spectra
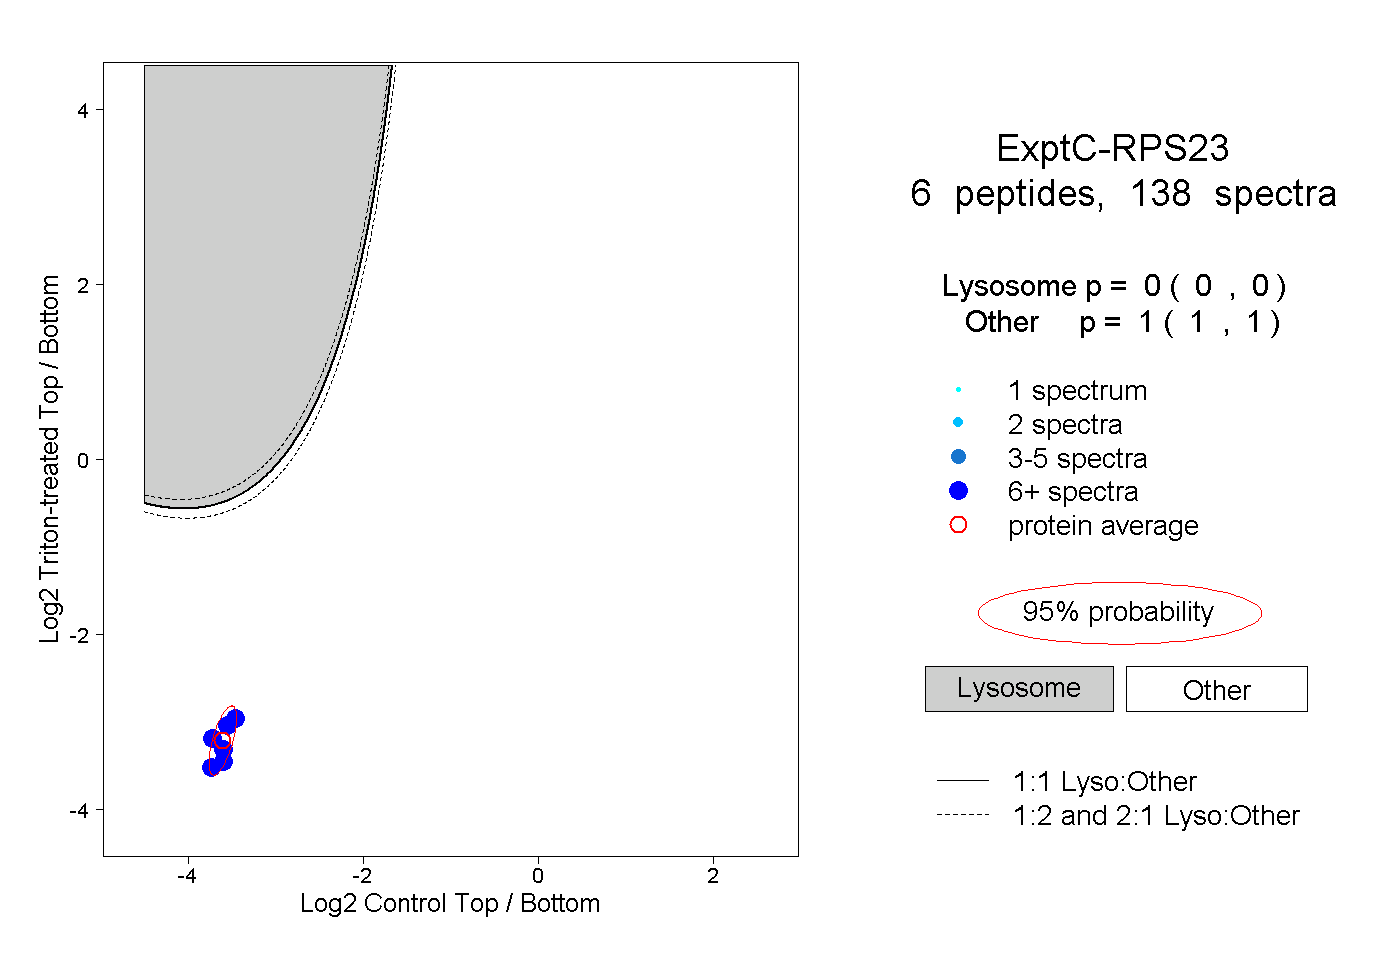
0.000 | 0.000
1.000 | 1.000
5peptides
spectra
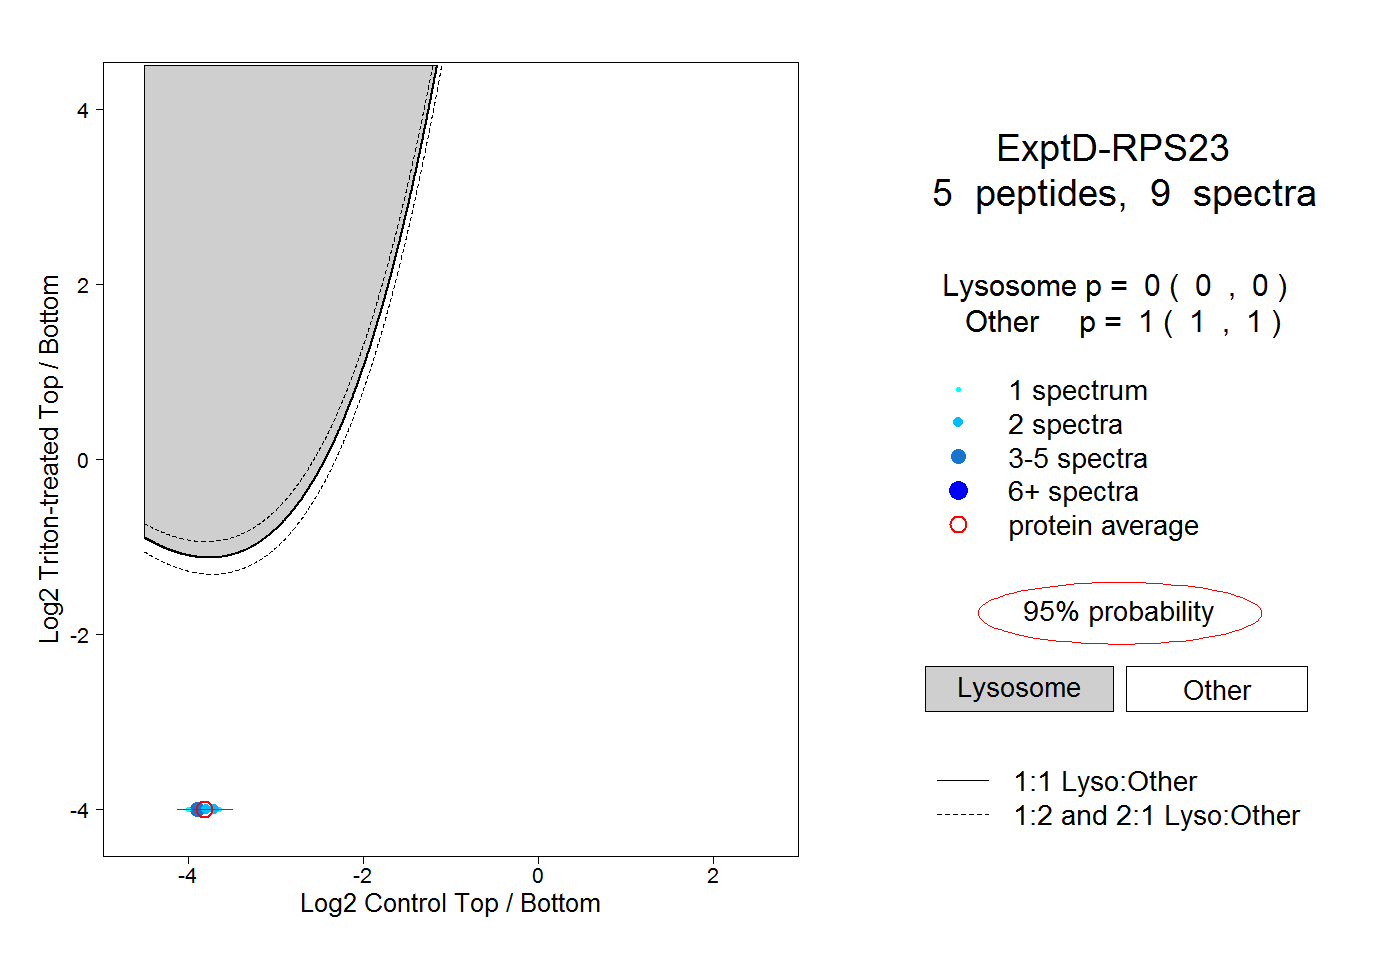
0.000 | 0.000
1.000 | 1.000