RPS23
[ENSRNOP00000022348]
Main page
| | | Plot |
Mito |
Lyso |
|
Perox |
ER |
Golgi |
PM |
Cytosol |
Nucleus |
|
| Expt A |
 6
6
peptides |
69
spectra |
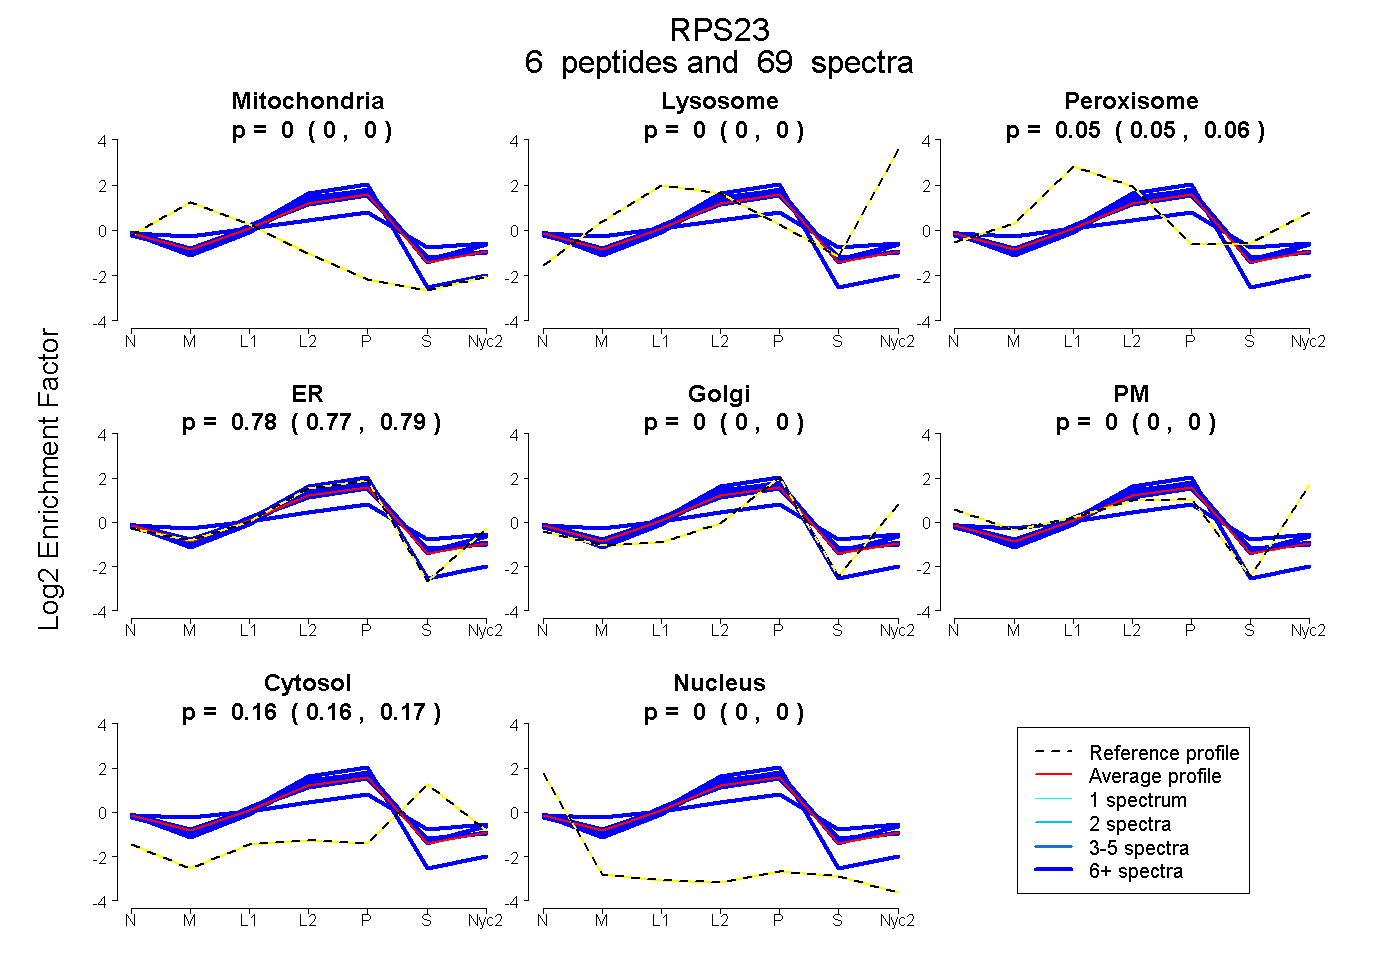 |
0.000
0.000 | 0.000 |
0.000
0.000 | 0.000 |
|
0.054
0.048 | 0.060 |
0.784
0.774 | 0.792 |
0.000
0.000 | 0.000 |
0.000
0.000 | 0.000 |
0.162
0.156 | 0.167 |
0.000
0.000 | 0.000 |
|
| | | Plot |
Mito |
|
Lyso or Perox |
|
ER |
Golgi |
PM |
Cytosol |
Nucleus |
|
| Expt B |
6
peptides |
28
spectra |
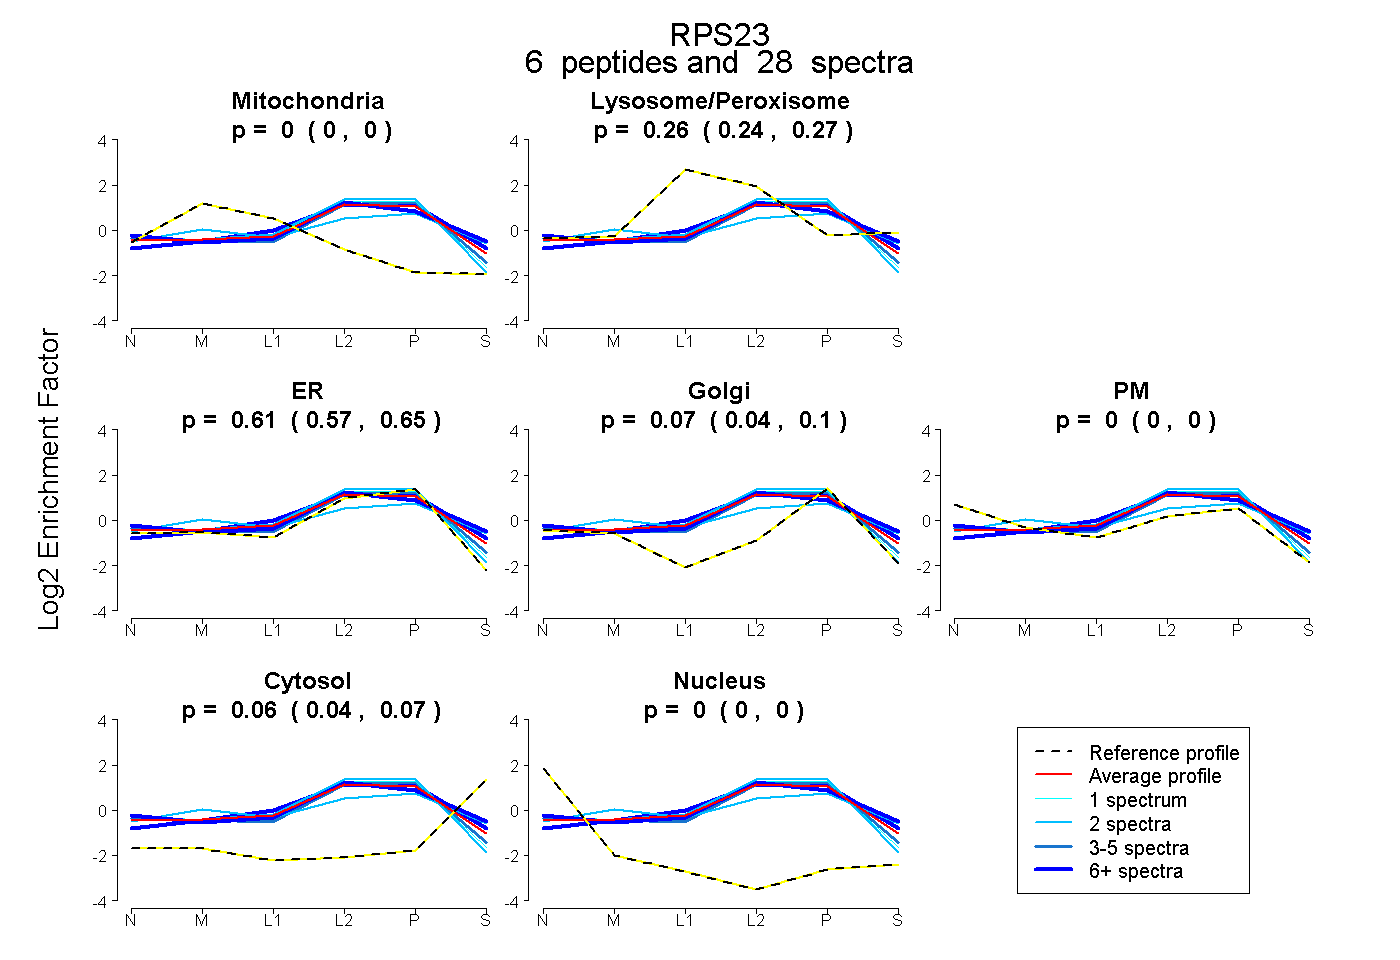 |
0.000
0.000 | 0.000 |
|
0.260
0.244 | 0.274 |
|
0.615
0.575 | 0.647 |
0.070
0.039 | 0.097 |
0.000
0.000 | 0.000 |
0.055
0.043 | 0.066 |
0.000
0.000 | 0.000 |
|
| 3 spectra, ANPFGGAFHAK |
0.000 |
|
0.161 |
|
0.733 |
0.060 |
0.024 |
0.021 |
0.000 |
|
| 11 spectra, VANVSLLALYK |
0.000 |
|
0.280 |
|
0.526 |
0.000 |
0.071 |
0.123 |
0.000 |
|
| 2 spectra, GHAVGDIPGVR |
0.000 |
|
0.427 |
|
0.000 |
0.530 |
0.000 |
0.043 |
0.000 |
|
| 2 spectra, VGVEAK |
0.000 |
|
0.160 |
|
0.840 |
0.000 |
0.000 |
0.000 |
0.000 |
|
| 1 spectrum, GIVLEK |
0.000 |
|
0.174 |
|
0.790 |
0.000 |
0.036 |
0.000 |
0.000 |
|
| 9 spectra, AHLGTALK |
0.000 |
|
0.288 |
|
0.625 |
0.000 |
0.000 |
0.088 |
0.000 |
|
| | | Plot |
|
Lyso |
|
|
|
|
|
|
|
Other |
| Expt C |
6
peptides |
138
spectra |
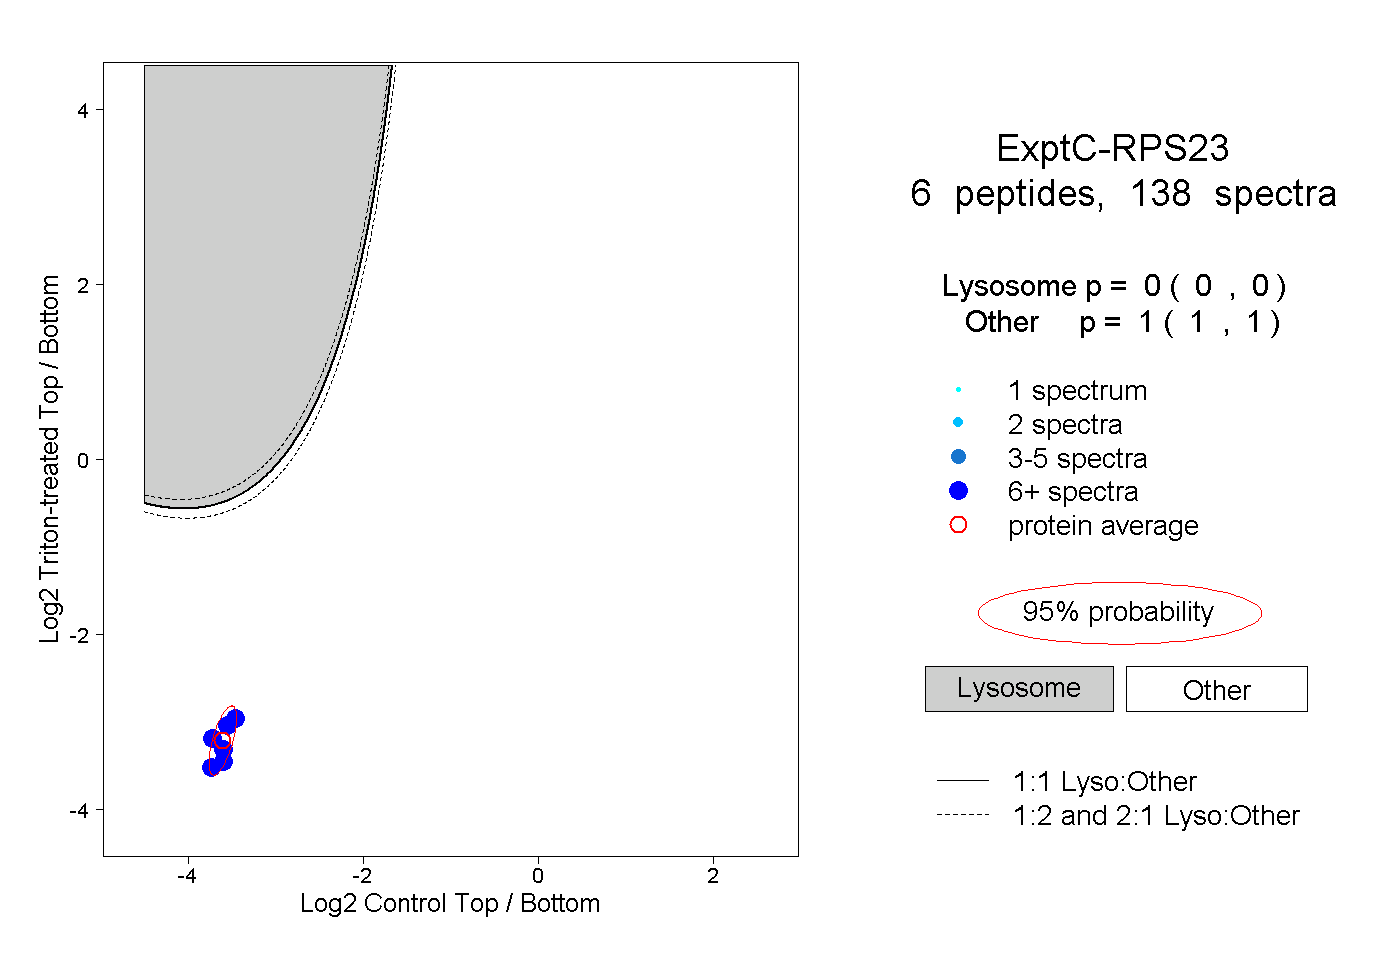 |
|
0.000
0.000 | 0.000 |
|
|
|
|
|
|
|
1.000
1.000 | 1.000 |
| | | Plot |
|
Lyso |
|
|
|
|
|
|
|
Other |
| Expt D |
5
peptides |
9
spectra |
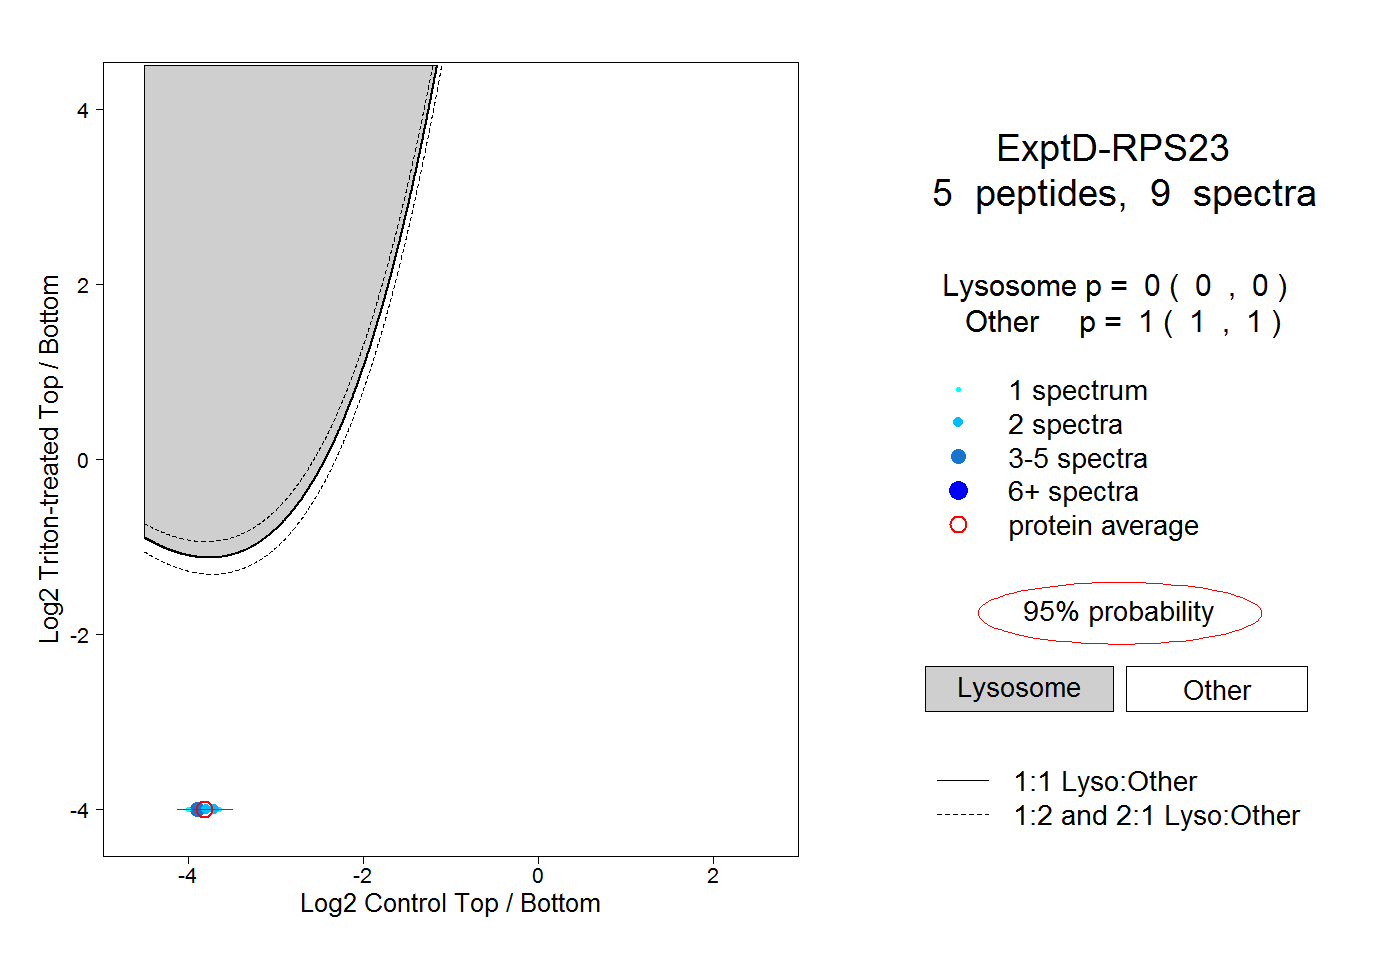 |
|
0.000
0.000 | 0.000 |
|
|
|
|
|
|
|
1.000
1.000 | 1.000 |