 5
5peptides
spectra
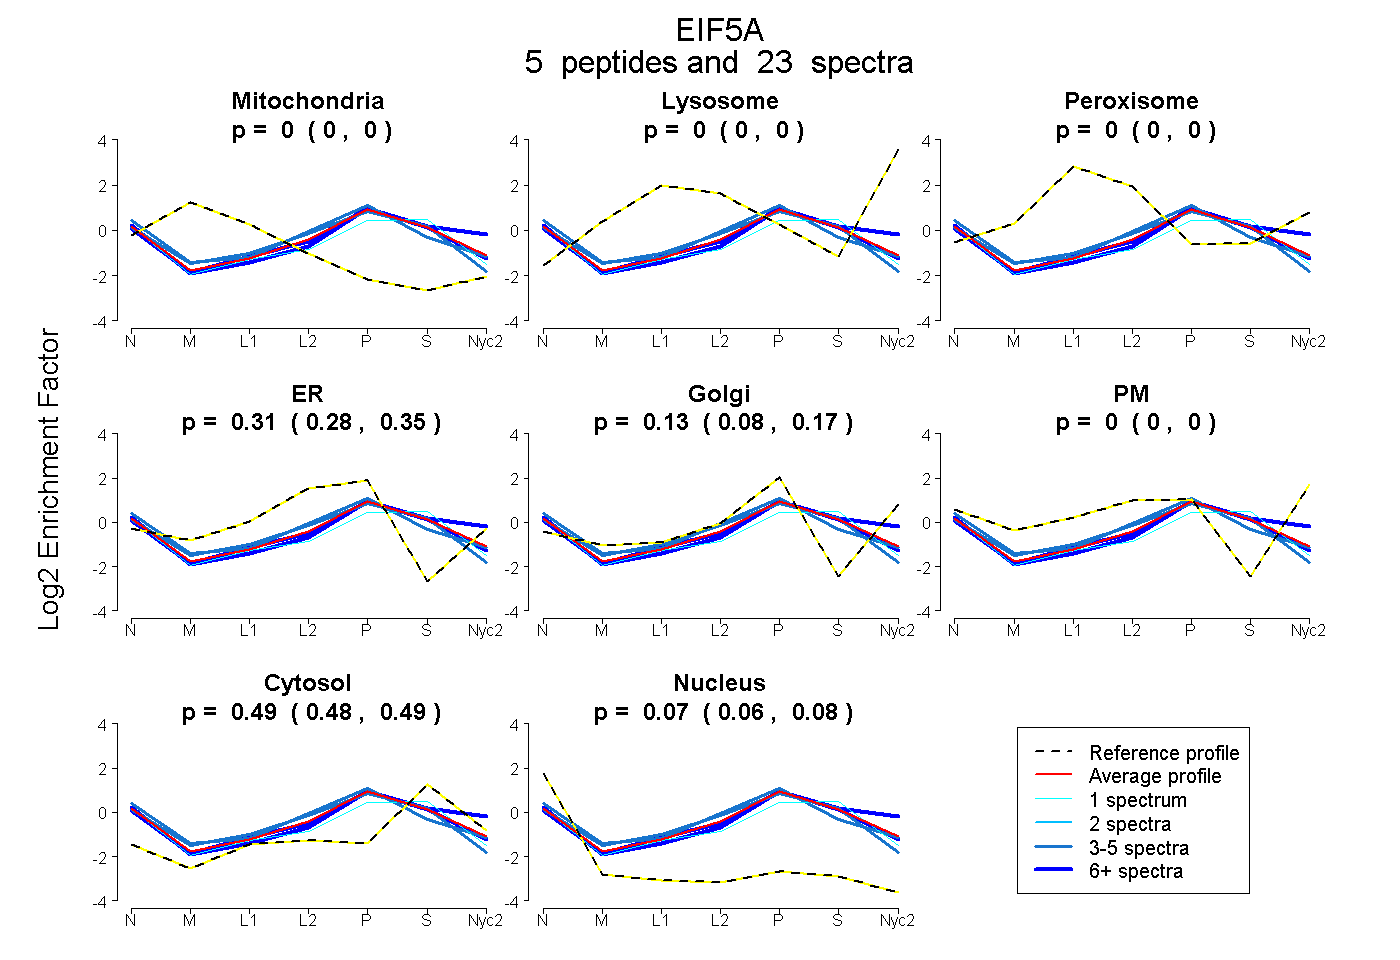
0.000 | 0.000
0.000 | 0.000
0.000 | 0.000
0.276 | 0.346
0.085 | 0.169
0.000 | 0.000
0.477 | 0.494
0.057 | 0.077
3peptides
spectra
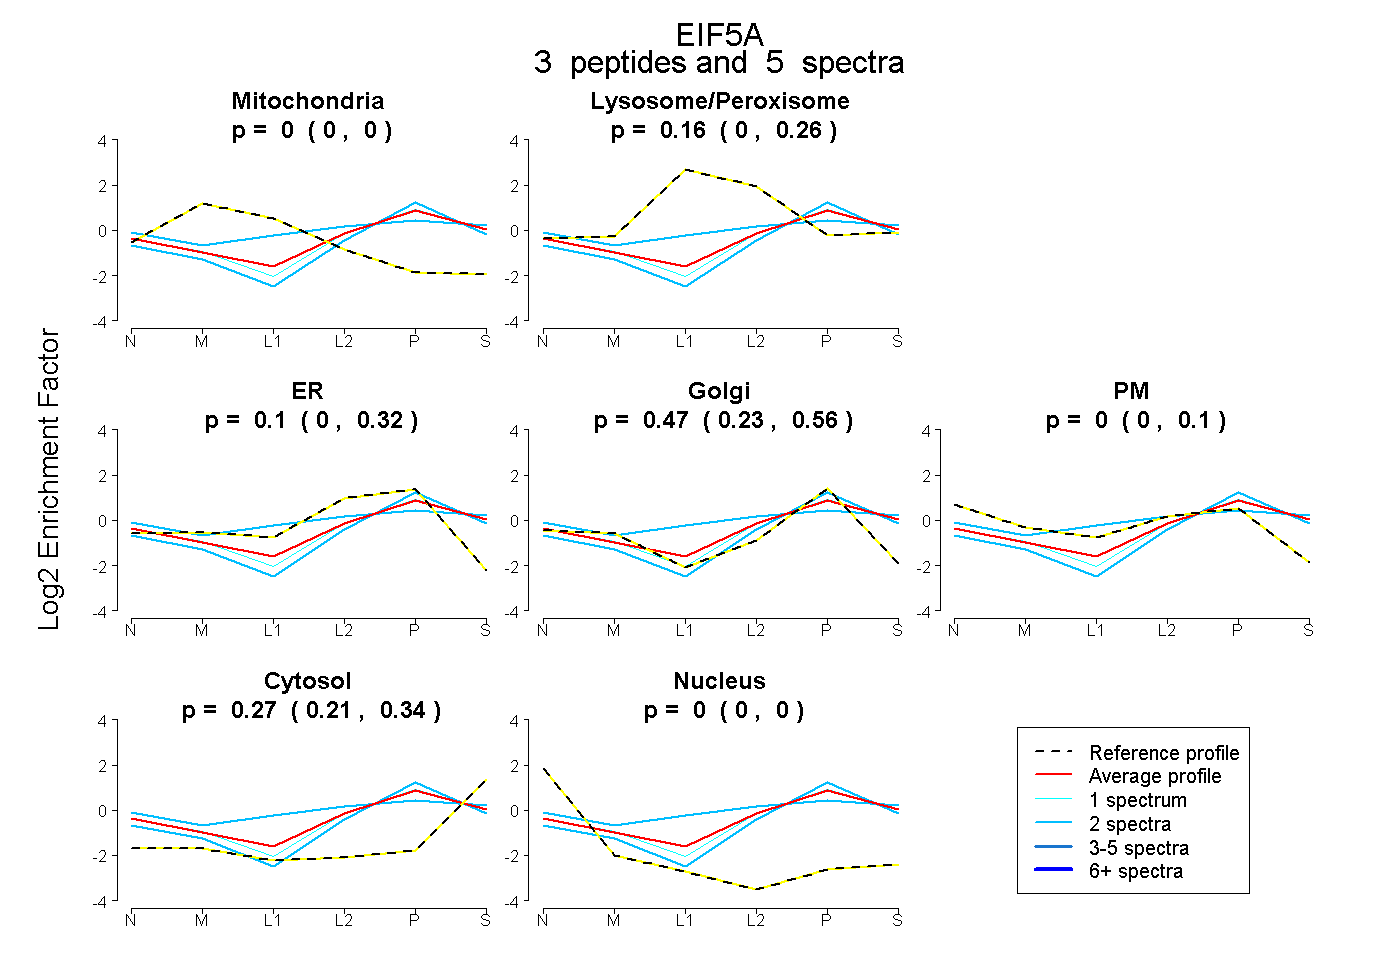
0.000 | 0.000
0.000 | 0.264
0.000 | 0.320
0.230 | 0.559
0.000 | 0.098
0.207 | 0.344
0.000 | 0.000
5peptides
spectra
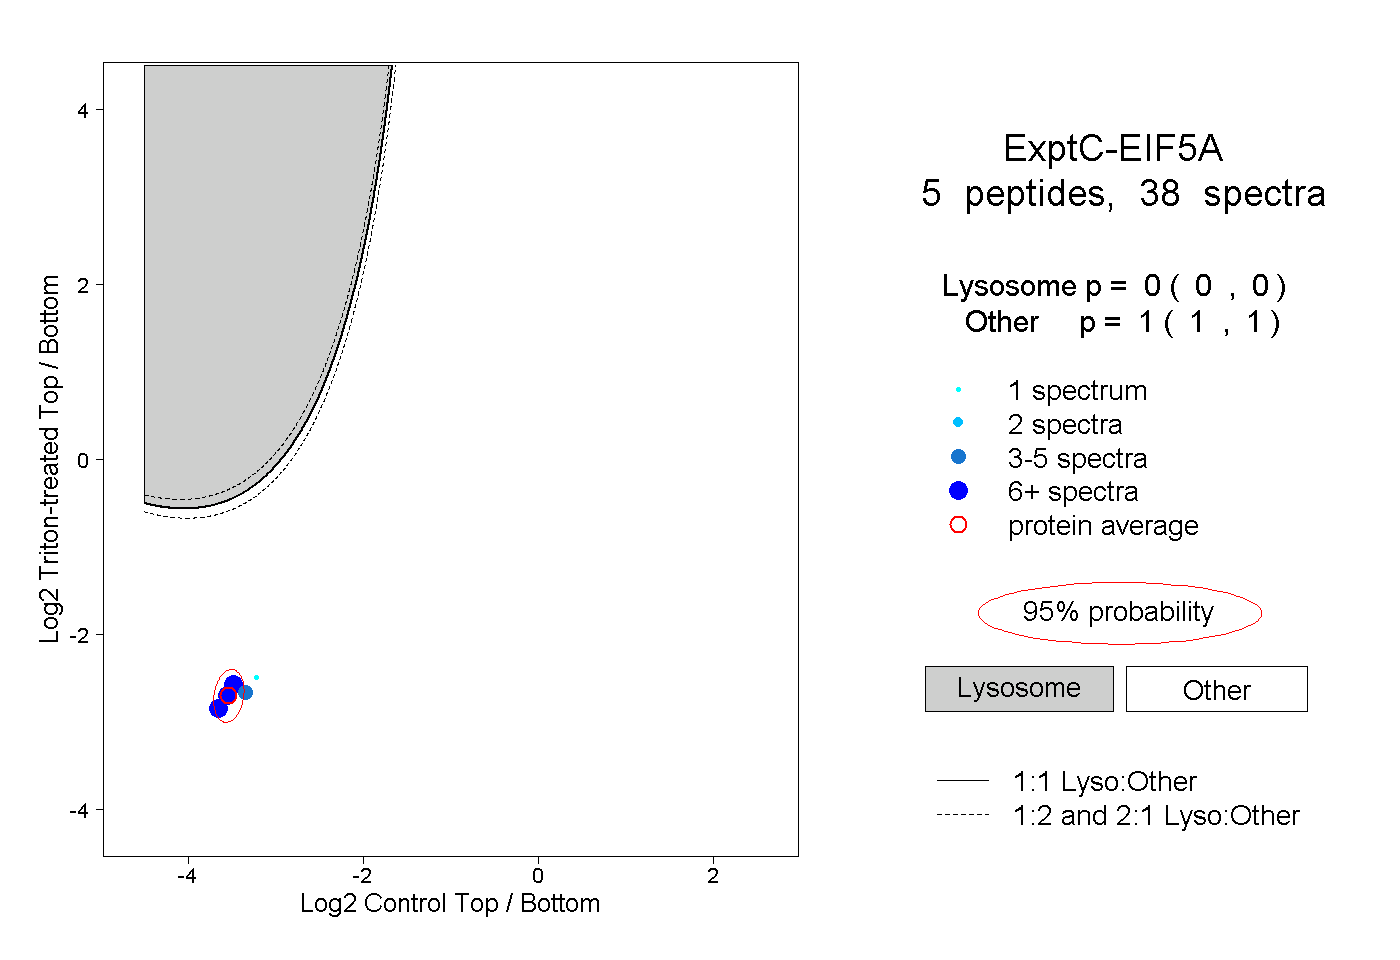
0.000 | 0.000
1.000 | 1.000
1peptide
spectrum
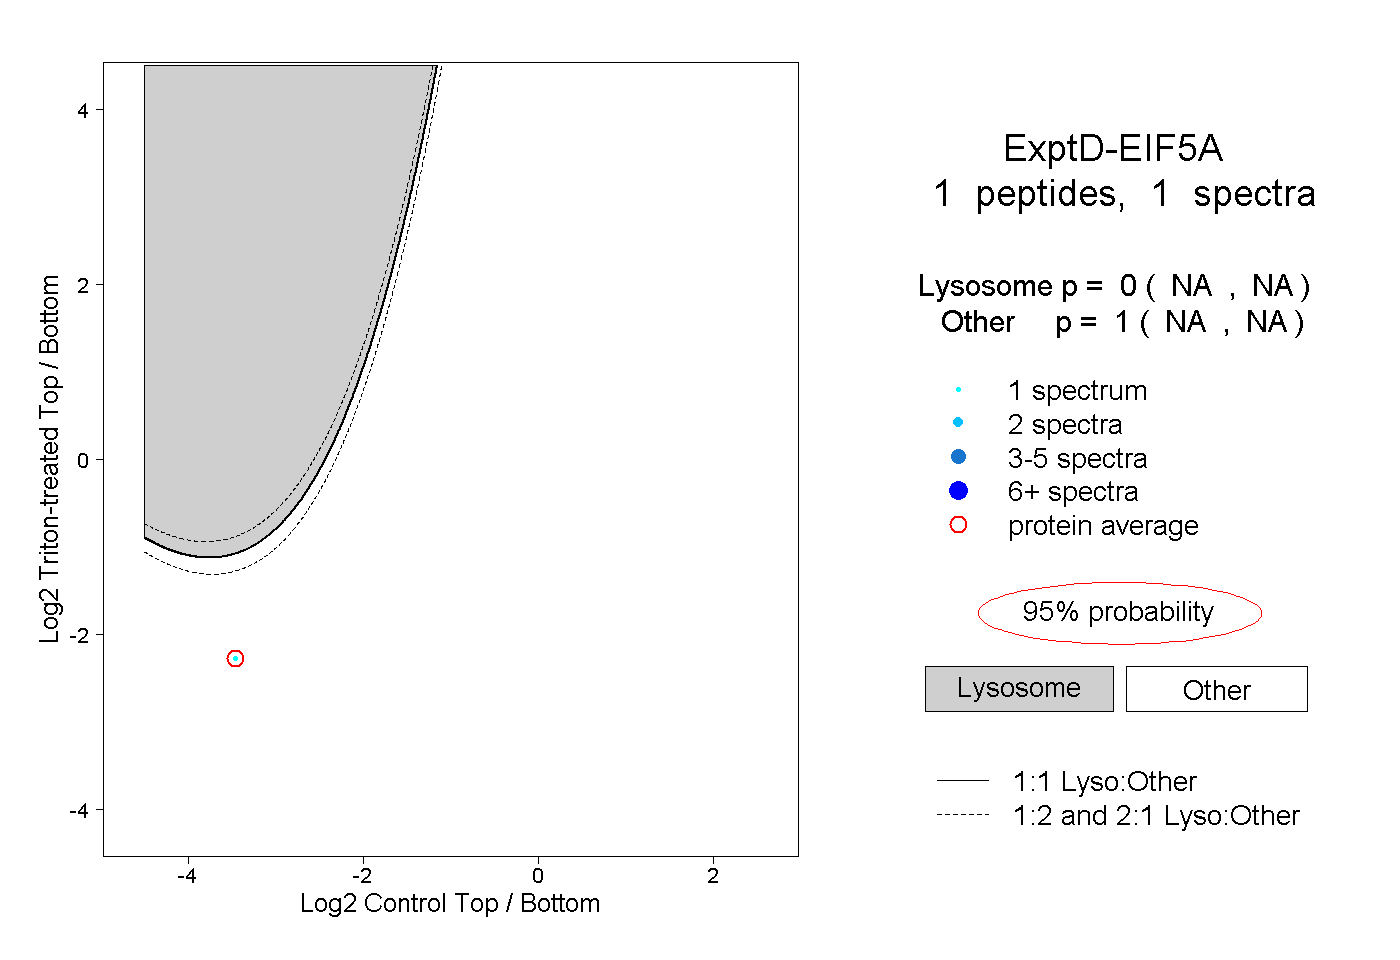
NA | NA
NA | NA