 5
5peptides
spectra
0.000 | 0.000
0.000 | 0.000
0.000 | 0.000
0.276 | 0.346
0.085 | 0.169
0.000 | 0.000
0.477 | 0.494
0.057 | 0.077
| Plot | Mito | Lyso | Perox | ER | Golgi | PM | Cytosol | Nucleus | |||||
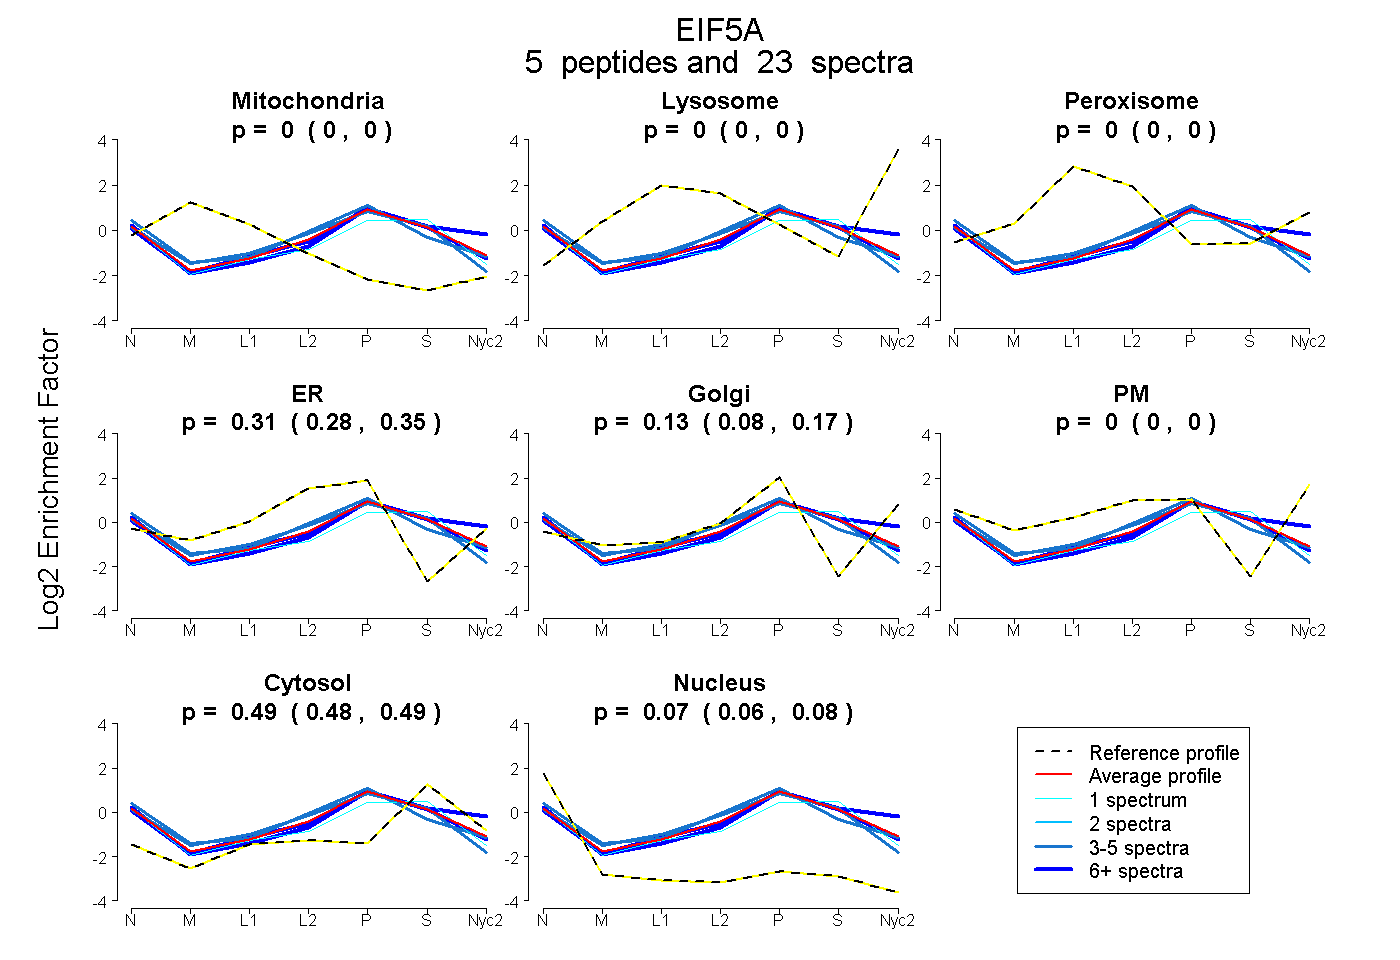
| Expt A |
5 peptides |
23 spectra |
|
0.000 0.000 | 0.000 |
0.000 0.000 | 0.000 |
0.000 0.000 | 0.000 |
0.315 0.276 | 0.346 |
0.132 0.085 | 0.169 |
0.000 0.000 | 0.000 |
0.486 0.477 | 0.494 |
0.067 0.057 | 0.077 |
| 4 spectra, VHLVGIDIFTGK | 0.000 | 0.000 | 0.000 | 0.439 | 0.000 | 0.000 | 0.475 | 0.085 | ||
| 1 spectrum, YEDICPSTHNMDVPNIK | 0.000 | 0.000 | 0.000 | 0.278 | 0.025 | 0.000 | 0.585 | 0.112 | ||
| 9 spectra, LPEGDLGK | 0.000 | 0.000 | 0.000 | 0.223 | 0.196 | 0.000 | 0.482 | 0.099 | ||
| 6 spectra, IVEMSTSK | 0.000 | 0.000 | 0.000 | 0.056 | 0.413 | 0.032 | 0.499 | 0.000 | ||
| 3 spectra, NGFVVLK | 0.000 | 0.000 | 0.000 | 0.471 | 0.063 | 0.000 | 0.374 | 0.092 |
| Plot | Mito | Lyso or Perox | ER | Golgi | PM | Cytosol | Nucleus | ||||||
| Expt B |
3 peptides |
5 spectra |
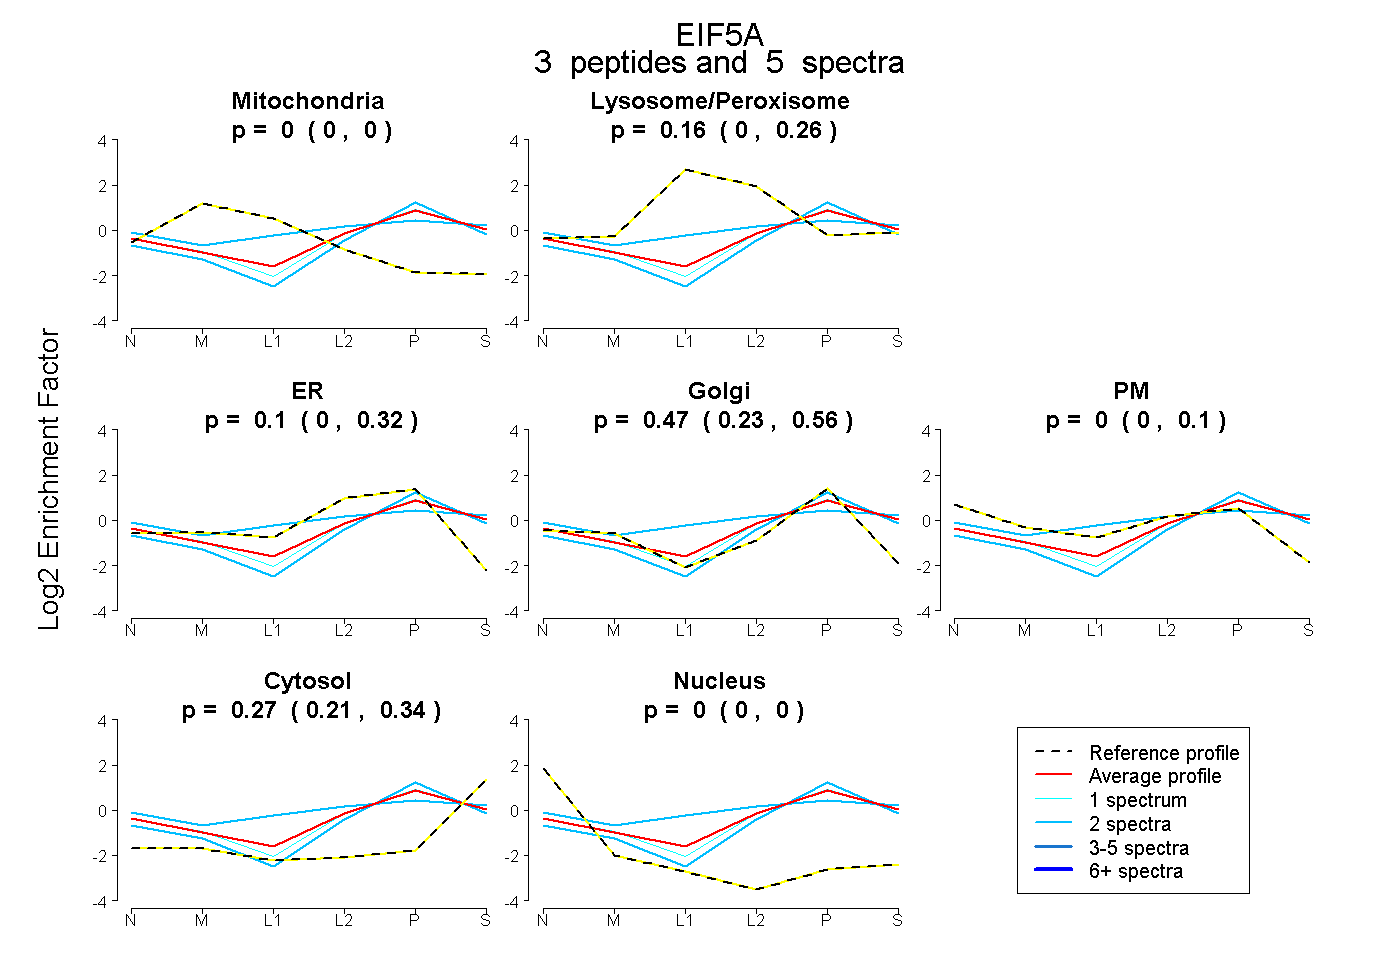 |
0.000 0.000 | 0.000 |
0.160 0.000 | 0.264 |
0.101 0.000 | 0.320 |
0.472 0.230 | 0.559 |
0.000 0.000 | 0.098 |
0.267 0.207 | 0.344 |
0.000 0.000 | 0.000 |
|||
| Plot | Lyso | Other | |||||||||||
| Expt C |
5 peptides |
38 spectra |
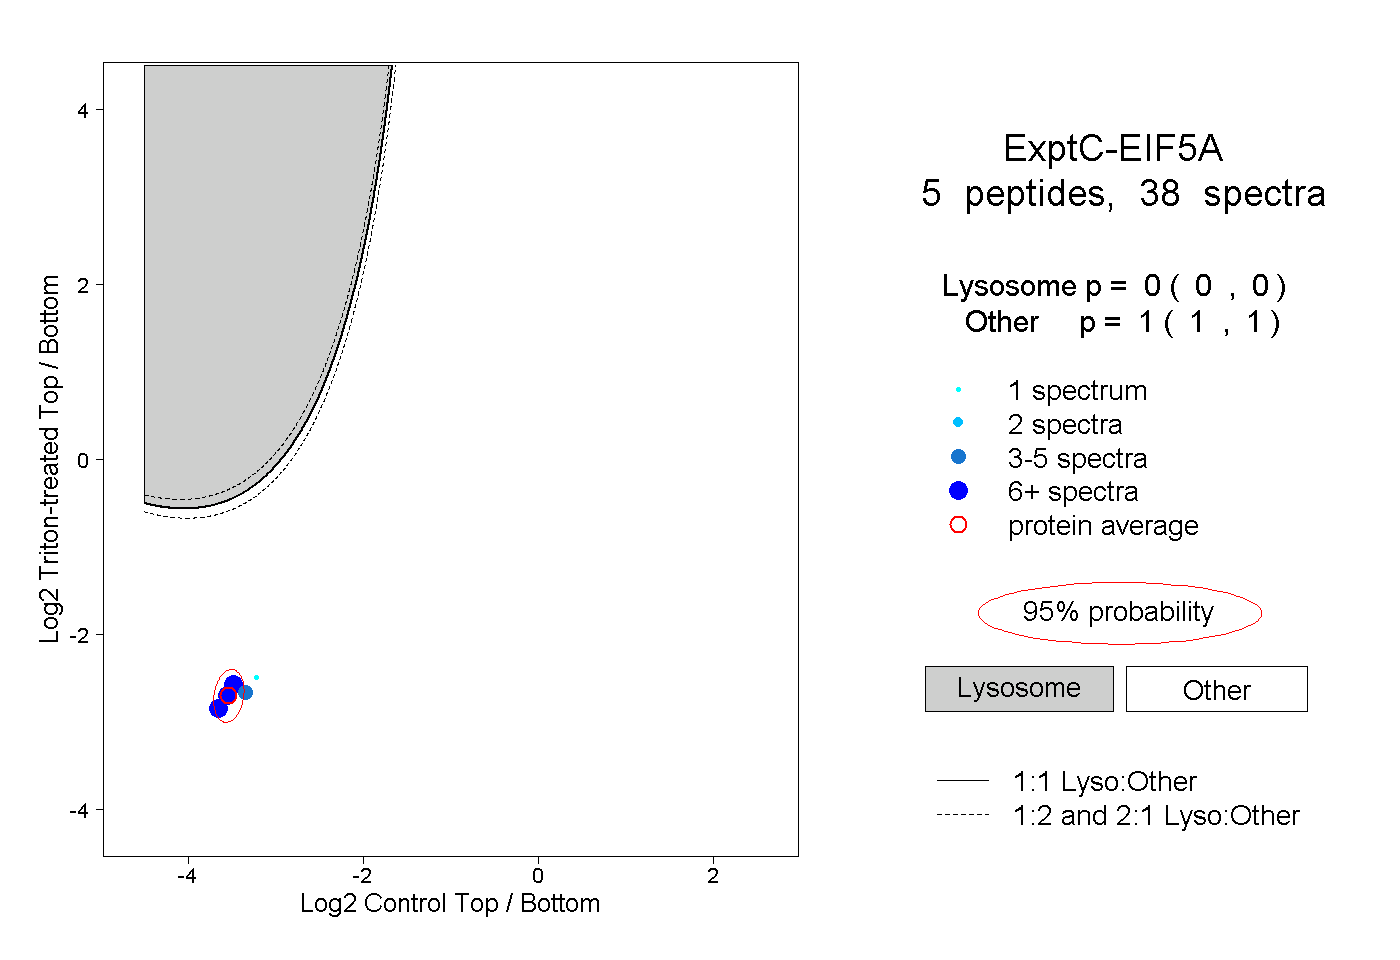 |
0.000 0.000 | 0.000 |
1.000 1.000 | 1.000 |
||||||||
| Plot | Lyso | Other | |||||||||||
| Expt D |
1 peptide |
1 spectrum |
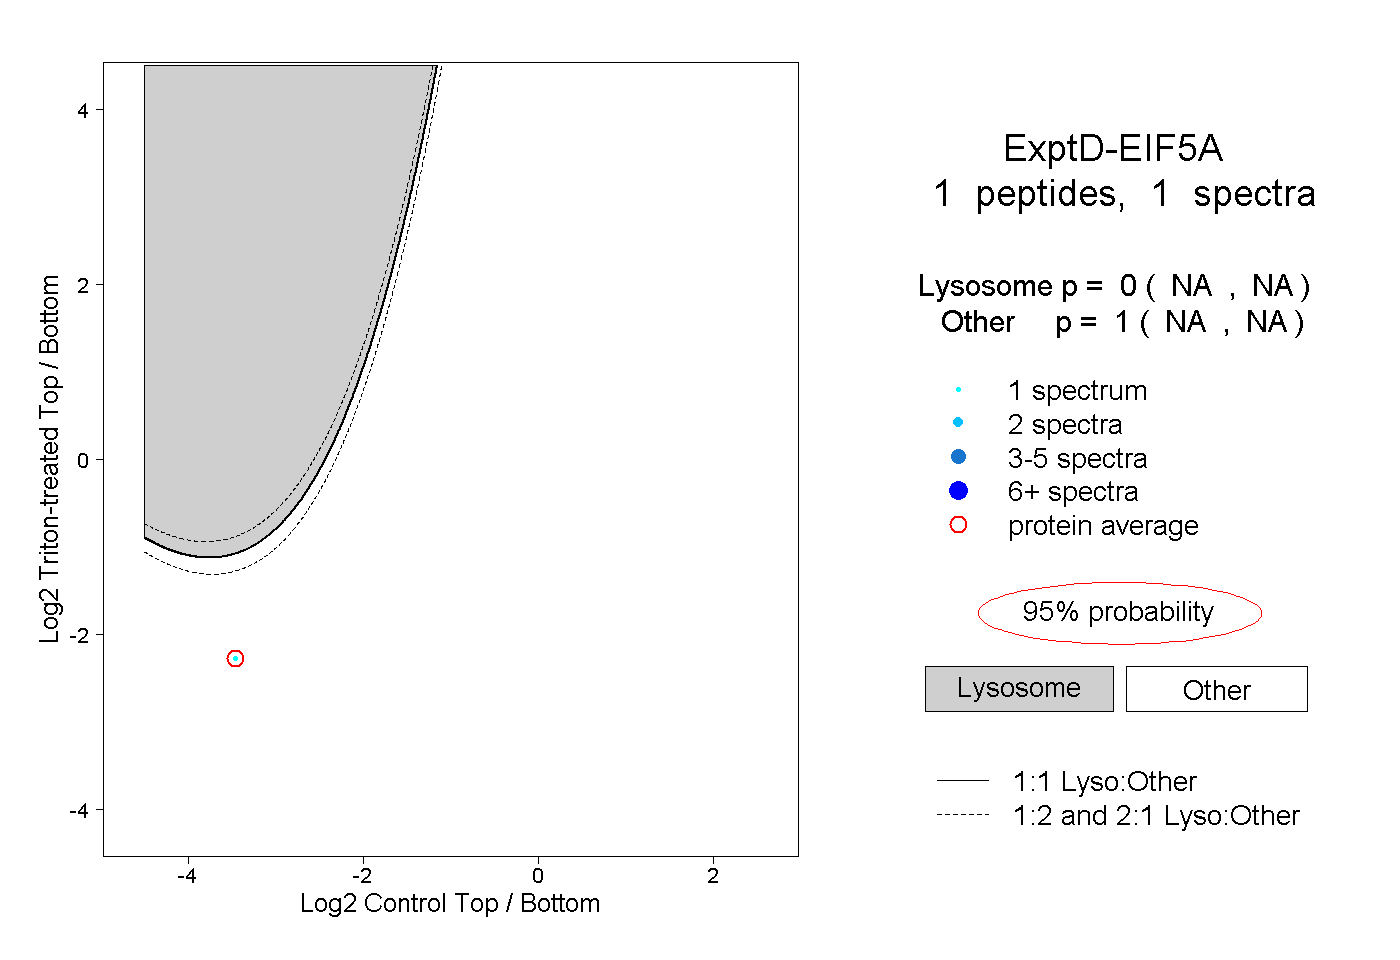 |
0.000 NA | NA |
1.000 NA | NA |