 16
16peptides
spectra
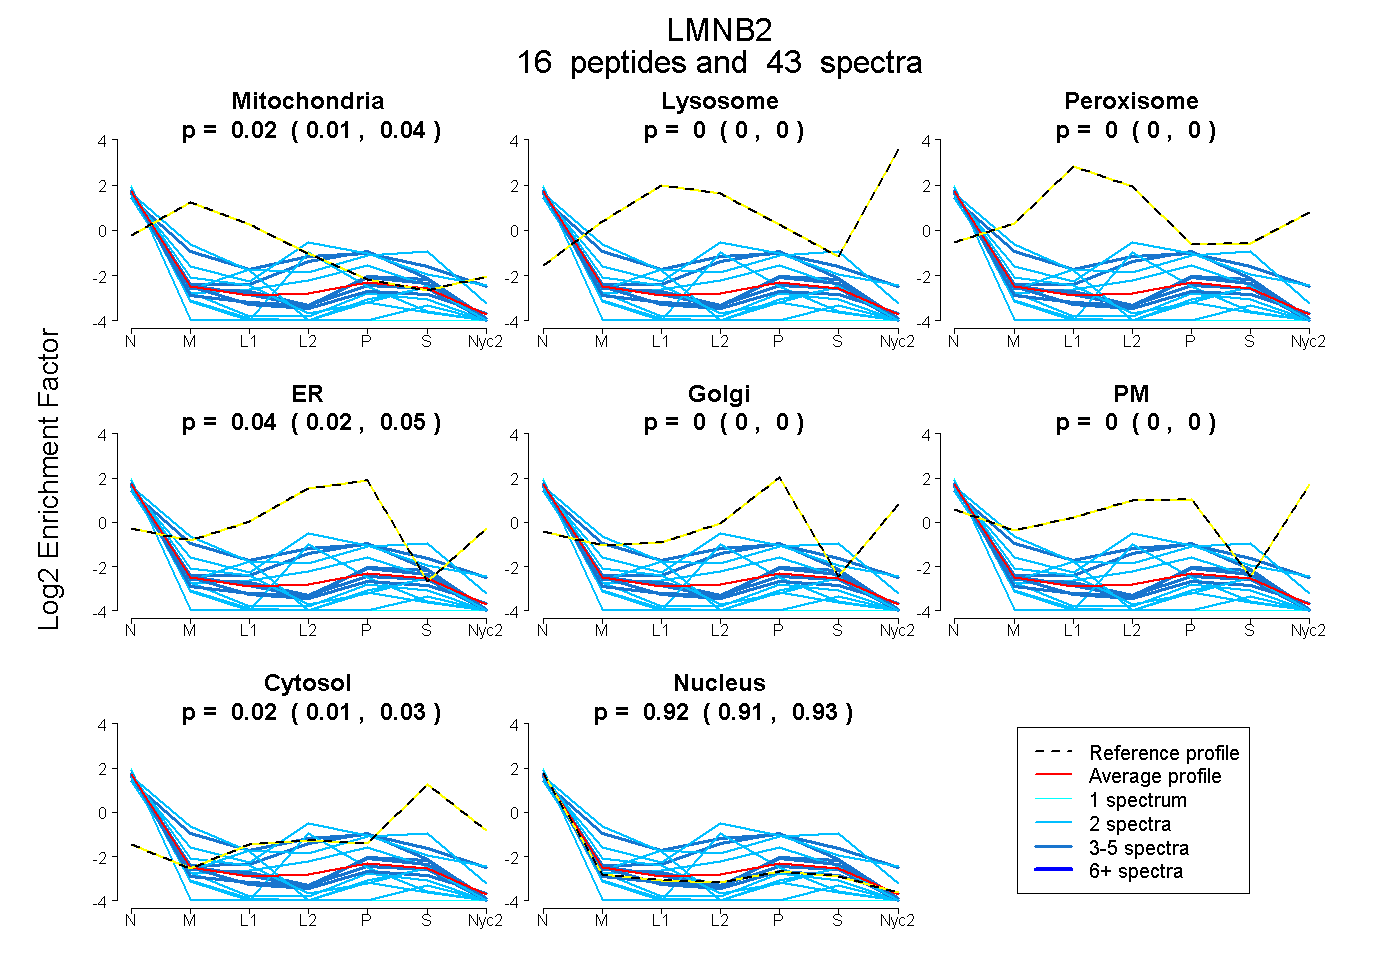
0.007 | 0.038
0.000 | 0.000
0.000 | 0.000
0.021 | 0.048
0.000 | 0.000
0.000 | 0.000
0.012 | 0.032
0.907 | 0.926
3peptides
spectra
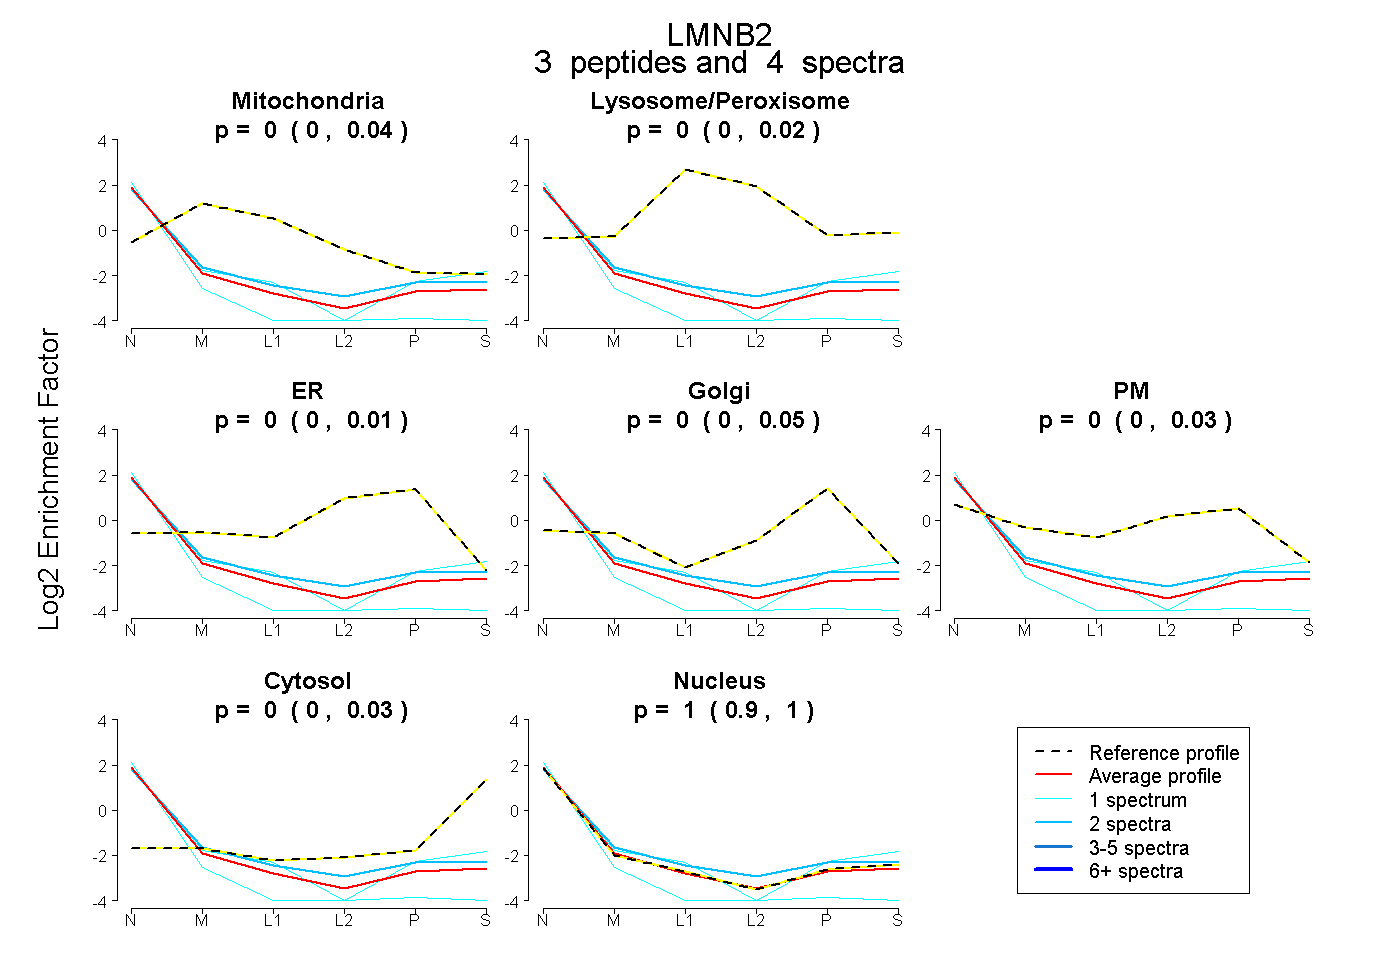
0.000 | 0.037
0.000 | 0.018
0.000 | 0.010
0.000 | 0.048
0.000 | 0.026
0.000 | 0.026
0.901 | 1.000