 16
16peptides
spectra
0.007 | 0.038
0.000 | 0.000
0.000 | 0.000
0.021 | 0.048
0.000 | 0.000
0.000 | 0.000
0.012 | 0.032
0.907 | 0.926
| Plot | Mito | Lyso | Perox | ER | Golgi | PM | Cytosol | Nucleus | |||||
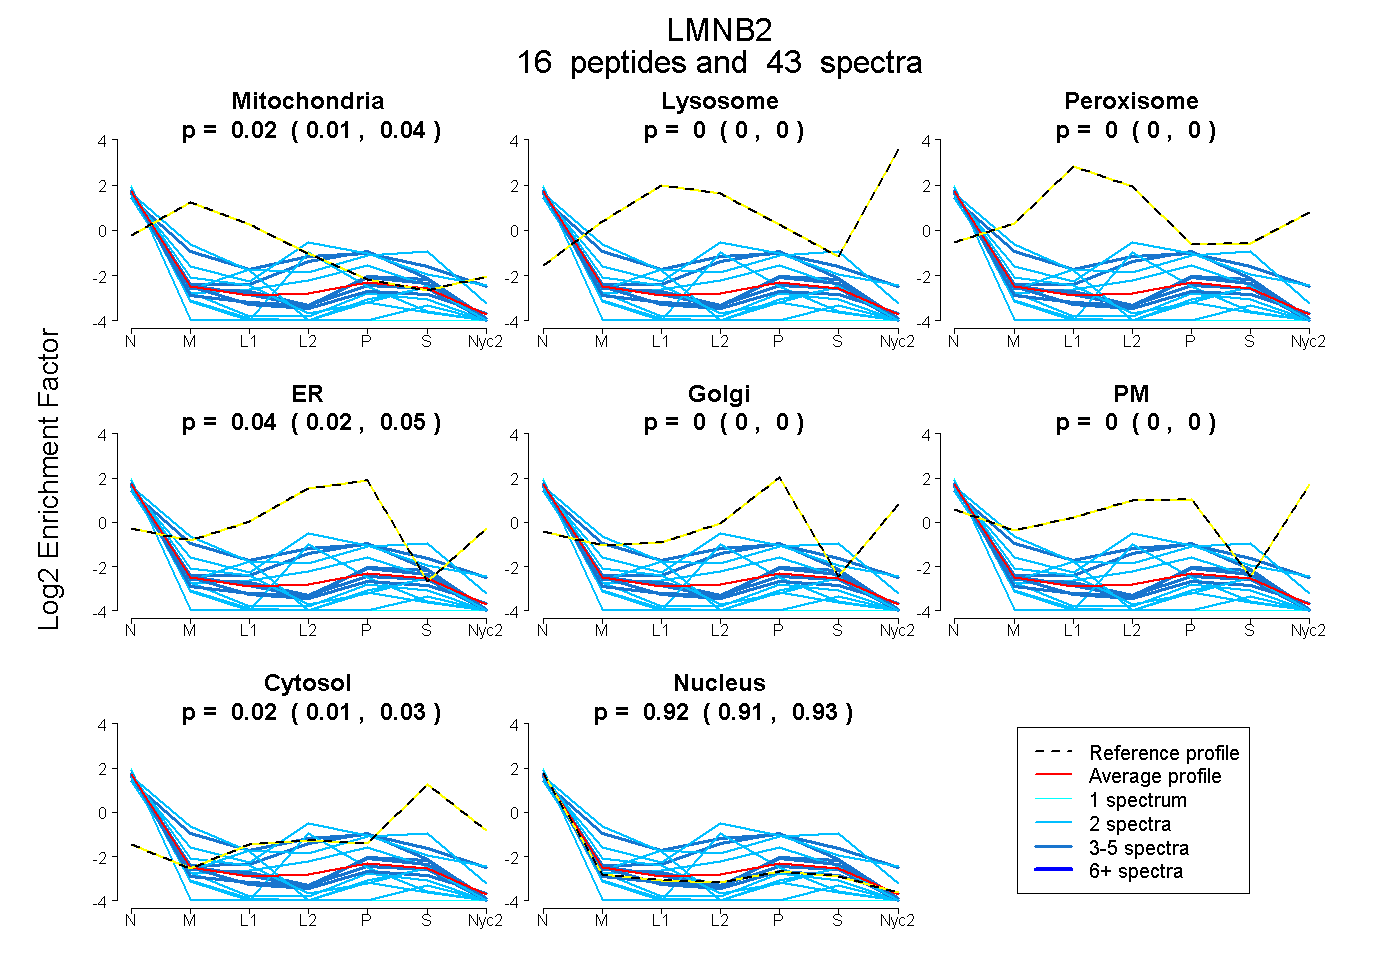
| Expt A |
16 peptides |
43 spectra |
|
0.024 0.007 | 0.038 |
0.000 0.000 | 0.000 |
0.000 0.000 | 0.000 |
0.036 0.021 | 0.048 |
0.000 0.000 | 0.000 |
0.000 0.000 | 0.000 |
0.023 0.012 | 0.032 |
0.917 0.907 | 0.926 |
| 2 spectra, SEAELAAALGDK | 0.264 | 0.000 | 0.000 | 0.000 | 0.000 | 0.000 | 0.000 | 0.736 | ||
| 4 spectra, AEDGHAVAK | 0.000 | 0.000 | 0.000 | 0.258 | 0.000 | 0.000 | 0.001 | 0.742 | ||
| 4 spectra, TLYESELADAR | 0.000 | 0.000 | 0.000 | 0.000 | 0.000 | 0.000 | 0.036 | 0.964 | ||
| 2 spectra, SQHDEQVR | 0.000 | 0.000 | 0.000 | 0.081 | 0.000 | 0.000 | 0.000 | 0.919 | ||
| 4 spectra, LAHYIDR | 0.034 | 0.000 | 0.000 | 0.000 | 0.000 | 0.000 | 0.003 | 0.963 | ||
| 2 spectra, EQEMAEVR | 0.000 | 0.000 | 0.000 | 0.000 | 0.000 | 0.000 | 0.000 | 1.000 | ||
| 2 spectra, VQAELEEAK | 0.088 | 0.000 | 0.000 | 0.000 | 0.000 | 0.000 | 0.000 | 0.912 | ||
| 2 spectra, AGSATPLSPTR | 0.000 | 0.000 | 0.000 | 0.000 | 0.000 | 0.000 | 0.000 | 1.000 | ||
| 2 spectra, IAQALEELR | 0.000 | 0.000 | 0.000 | 0.000 | 0.000 | 0.000 | 0.000 | 1.000 | ||
| 5 spectra, SVFEEEVQETR | 0.000 | 0.000 | 0.000 | 0.000 | 0.000 | 0.000 | 0.000 | 1.000 | ||
| 3 spectra, ELEEALAGER | 0.005 | 0.000 | 0.000 | 0.000 | 0.000 | 0.000 | 0.069 | 0.926 | ||
| 4 spectra, ALELENDK | 0.149 | 0.000 | 0.057 | 0.225 | 0.000 | 0.000 | 0.078 | 0.490 | ||
| 2 spectra, HVLETEVAELR | 0.000 | 0.000 | 0.000 | 0.135 | 0.000 | 0.000 | 0.000 | 0.865 | ||
| 2 spectra, DLESLFHR | 0.000 | 0.000 | 0.050 | 0.334 | 0.000 | 0.000 | 0.034 | 0.583 | ||
| 2 spectra, EGELTVAR | 0.000 | 0.000 | 0.017 | 0.124 | 0.000 | 0.000 | 0.267 | 0.592 | ||
| 1 spectrum, AGQTVTVWAAGAGATHSPPSTLVWK | 0.000 | 0.000 | 0.000 | 0.000 | 0.000 | 0.000 | 0.000 | 1.000 |
| Plot | Mito | Lyso or Perox | ER | Golgi | PM | Cytosol | Nucleus | ||||||
| Expt B |
3 peptides |
4 spectra |
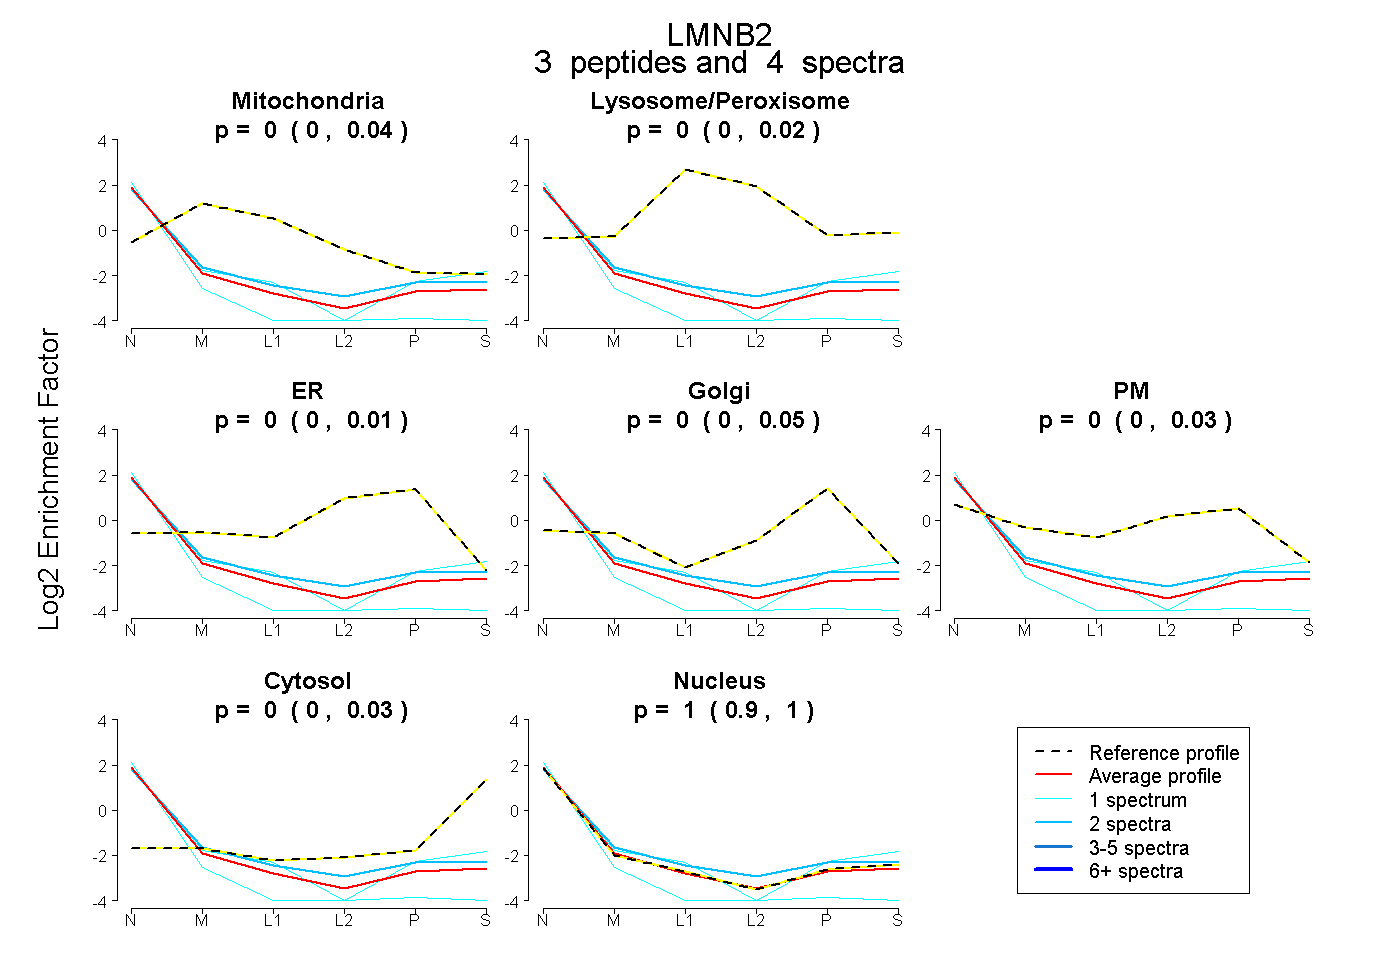 |
0.000 0.000 | 0.037 |
0.000 0.000 | 0.018 |
0.000 0.000 | 0.010 |
0.000 0.000 | 0.048 |
0.000 0.000 | 0.026 |
0.000 0.000 | 0.026 |
1.000 0.901 | 1.000 |