 5
5peptides
spectra
0.000 | 0.000
0.000 | 0.000
0.000 | 0.019
0.142 | 0.296
0.000 | 0.009
0.000 | 0.141
0.211 | 0.253
0.443 | 0.492
1peptide
spectra
0.000 | 0.000
1.000 | 1.000
| Plot | Mito | Lyso | Perox | ER | Golgi | PM | Cytosol | Nucleus | |||||
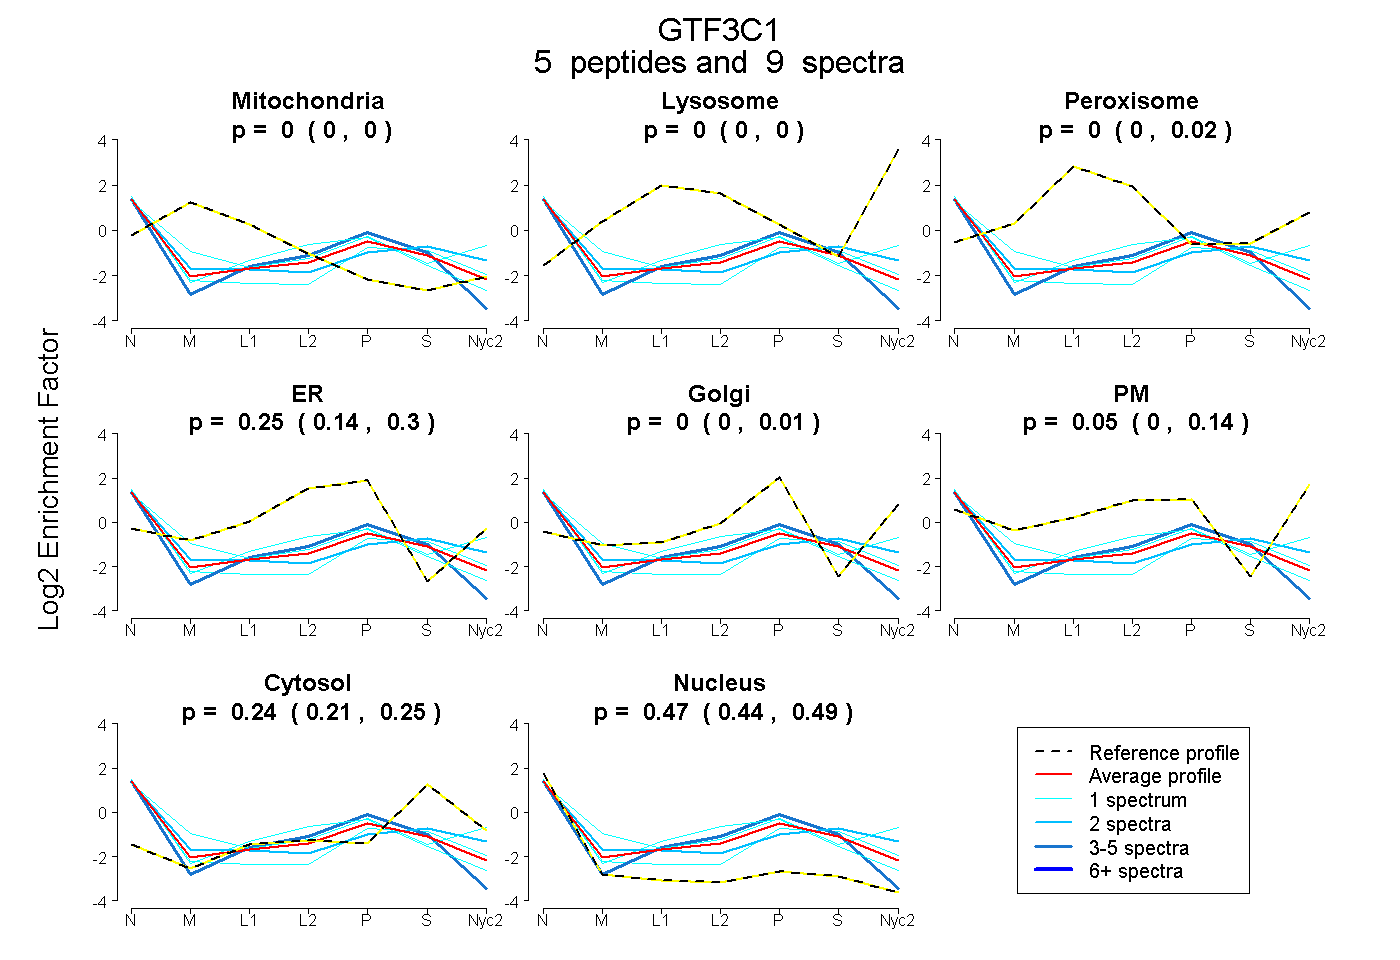
| Expt A |
5 peptides |
9 spectra |
|
0.000 0.000 | 0.000 |
0.000 0.000 | 0.000 |
0.000 0.000 | 0.019 |
0.247 0.142 | 0.296 |
0.000 0.000 | 0.009 |
0.048 0.000 | 0.141 |
0.238 0.211 | 0.253 |
0.467 0.443 | 0.492 |
||
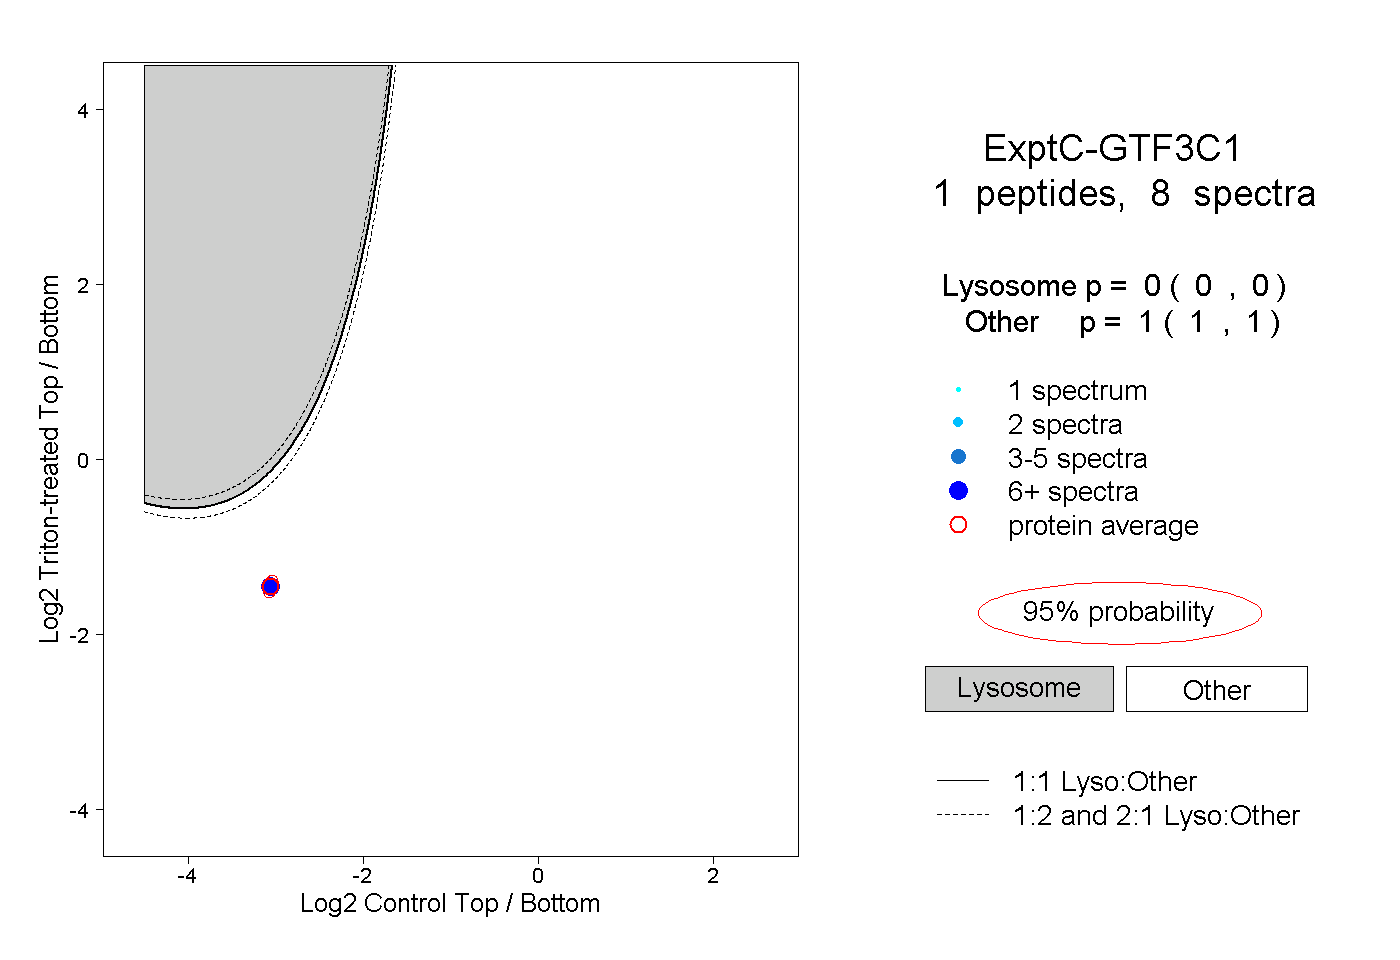
| Plot | Lyso | Other | |||||||||||
| Expt C |
1 peptide |
8 spectra |
|
0.000 0.000 | 0.000 |
1.000 1.000 | 1.000 |