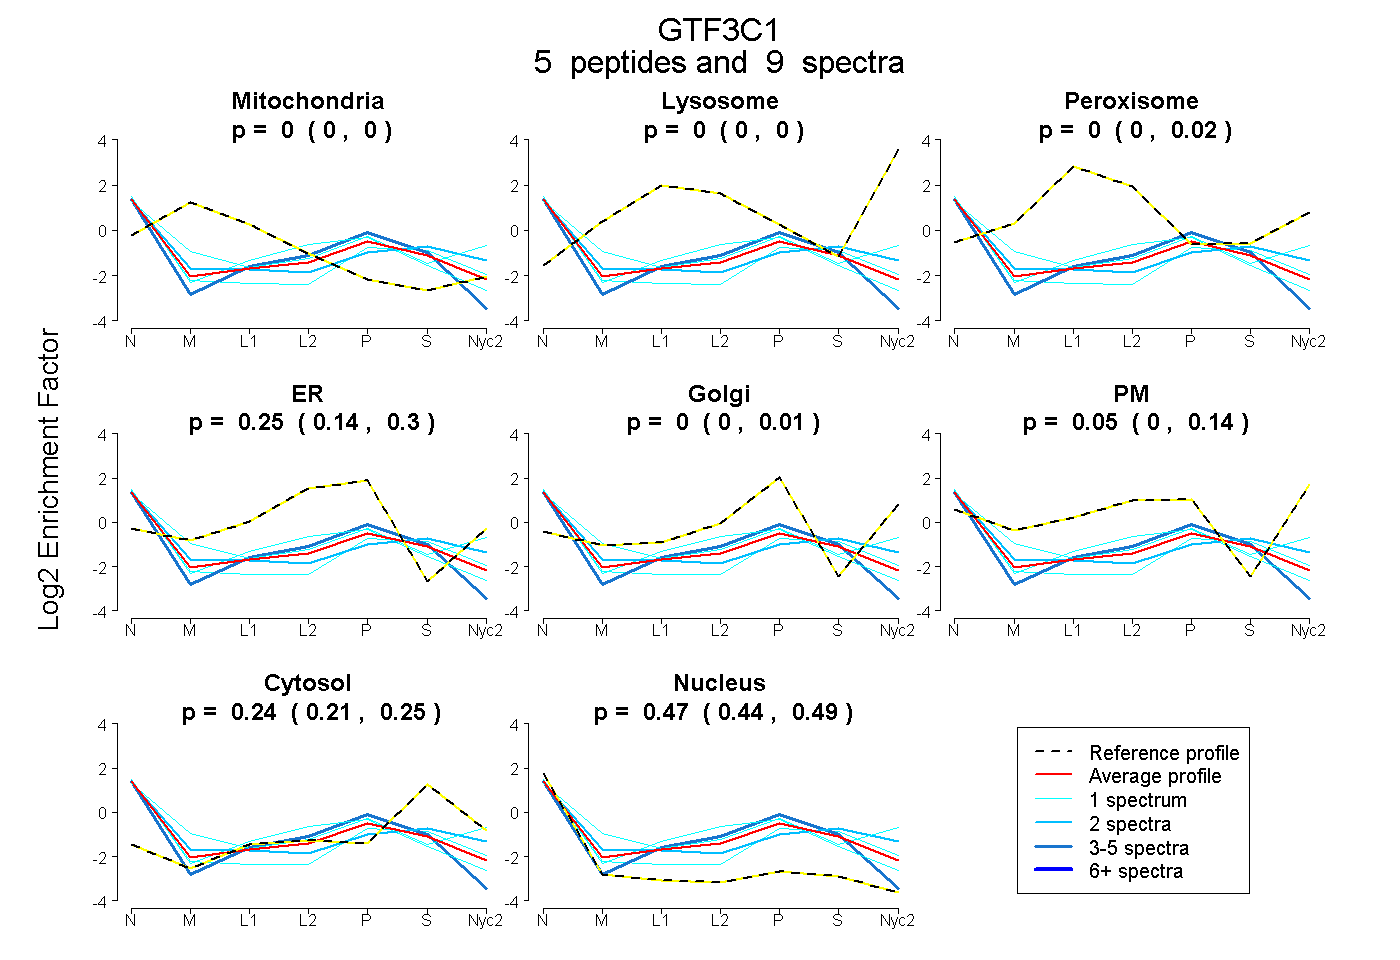
 5
5peptides
spectra
0.000 | 0.000
0.000 | 0.000
0.000 | 0.019
0.142 | 0.296
0.000 | 0.009
0.000 | 0.141
0.211 | 0.253
0.443 | 0.492
| Plot | Mito | Lyso | Perox | ER | Golgi | PM | Cytosol | Nucleus | |||||
| Expt A |
5 peptides |
9 spectra |
|
0.000 0.000 | 0.000 |
0.000 0.000 | 0.000 |
0.000 0.000 | 0.019 |
0.247 0.142 | 0.296 |
0.000 0.000 | 0.009 |
0.048 0.000 | 0.141 |
0.238 0.211 | 0.253 |
0.467 0.443 | 0.492 |
| 2 spectra, YQDEADQNALR | 0.000 | 0.000 | 0.000 | 0.000 | 0.000 | 0.257 | 0.320 | 0.423 | ||
| 4 spectra, RPMPLGSGGSGR | 0.000 | 0.000 | 0.000 | 0.281 | 0.000 | 0.000 | 0.202 | 0.516 | ||
| 1 spectrum, VCFVGRPWR | 0.000 | 0.000 | 0.026 | 0.377 | 0.000 | 0.000 | 0.106 | 0.490 | ||
| 1 spectrum, YVPPIPIHR | 0.001 | 0.000 | 0.000 | 0.000 | 0.040 | 0.443 | 0.147 | 0.369 | ||
| 1 spectrum, NYKPVIVPGLGR | 0.000 | 0.000 | 0.000 | 0.000 | 0.201 | 0.000 | 0.277 | 0.523 |
| Plot | Lyso | Other | |||||||||||
| Expt C |
1 peptide |
8 spectra |
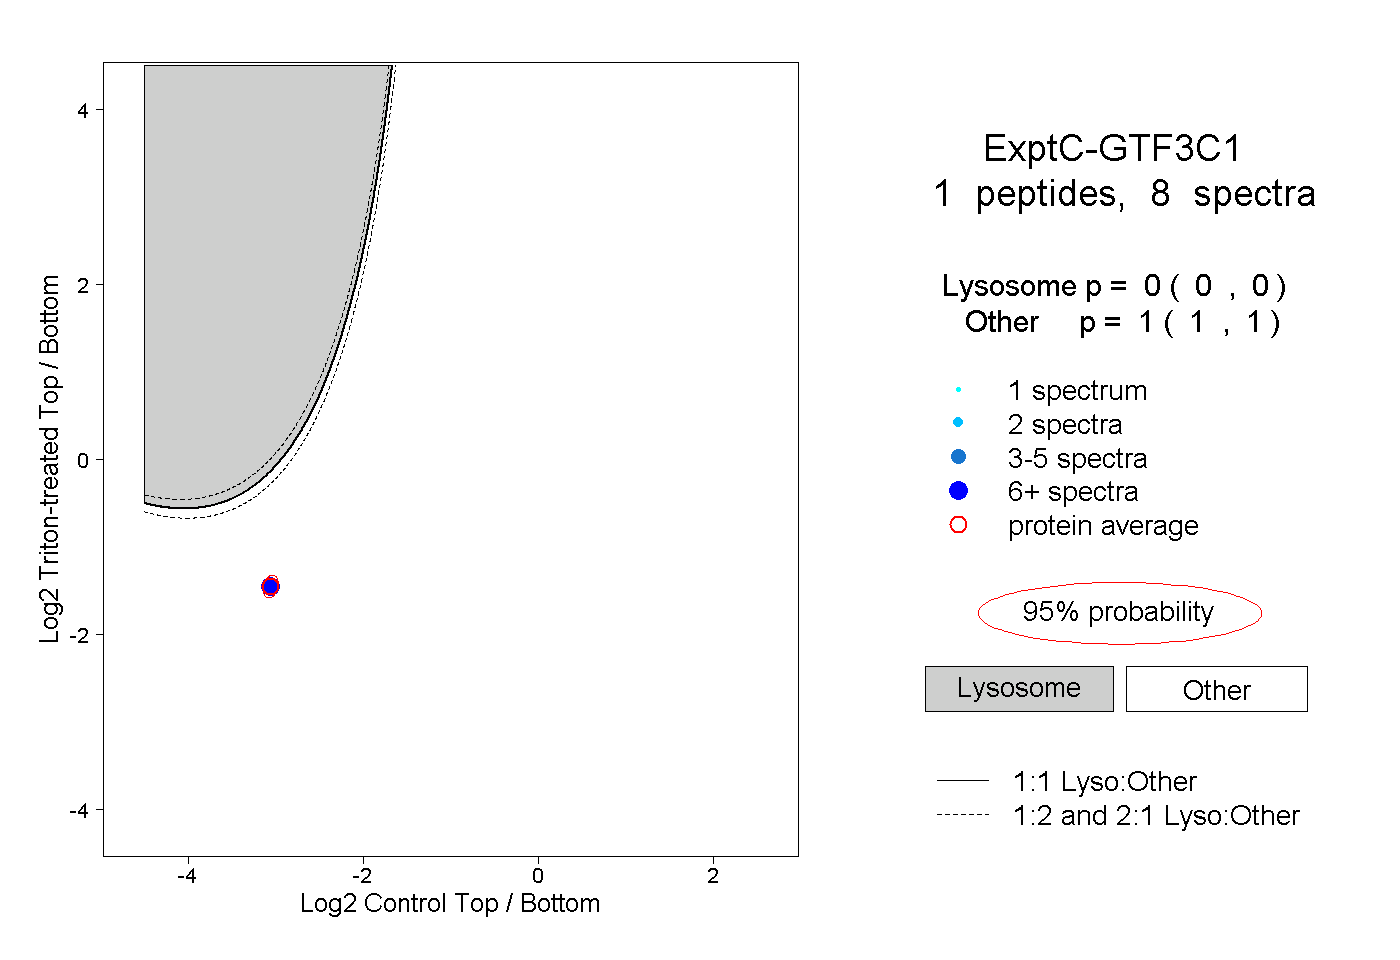 |
0.000 0.000 | 0.000 |
1.000 1.000 | 1.000 |