 5
5peptides
spectra
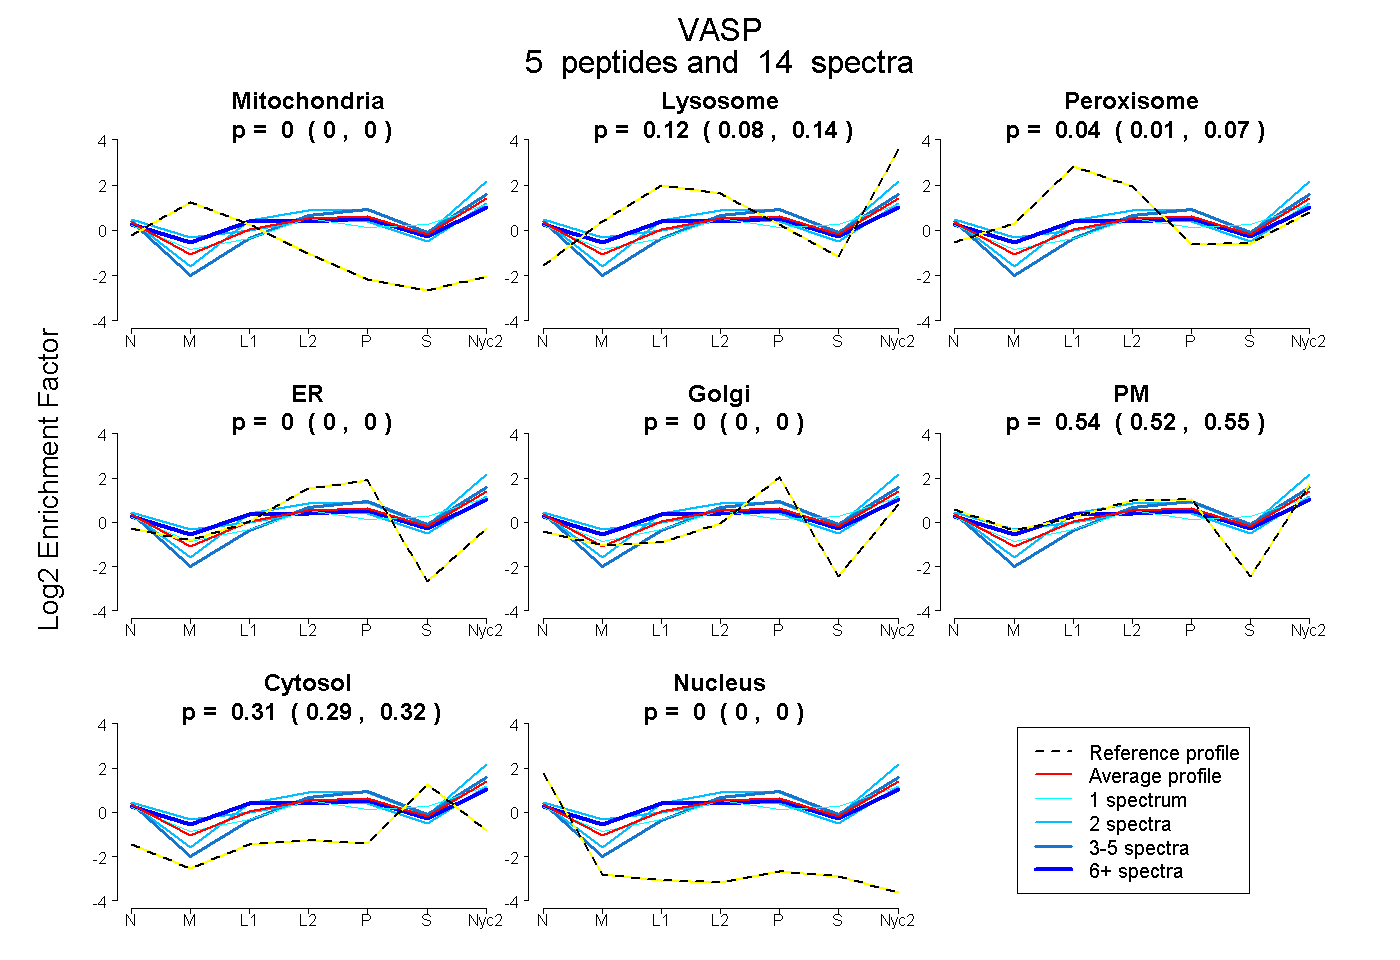
0.000 | 0.000
0.082 | 0.143
0.008 | 0.072
0.000 | 0.000
0.000 | 0.000
0.521 | 0.551
0.291 | 0.318
0.000 | 0.000
6peptides
spectra
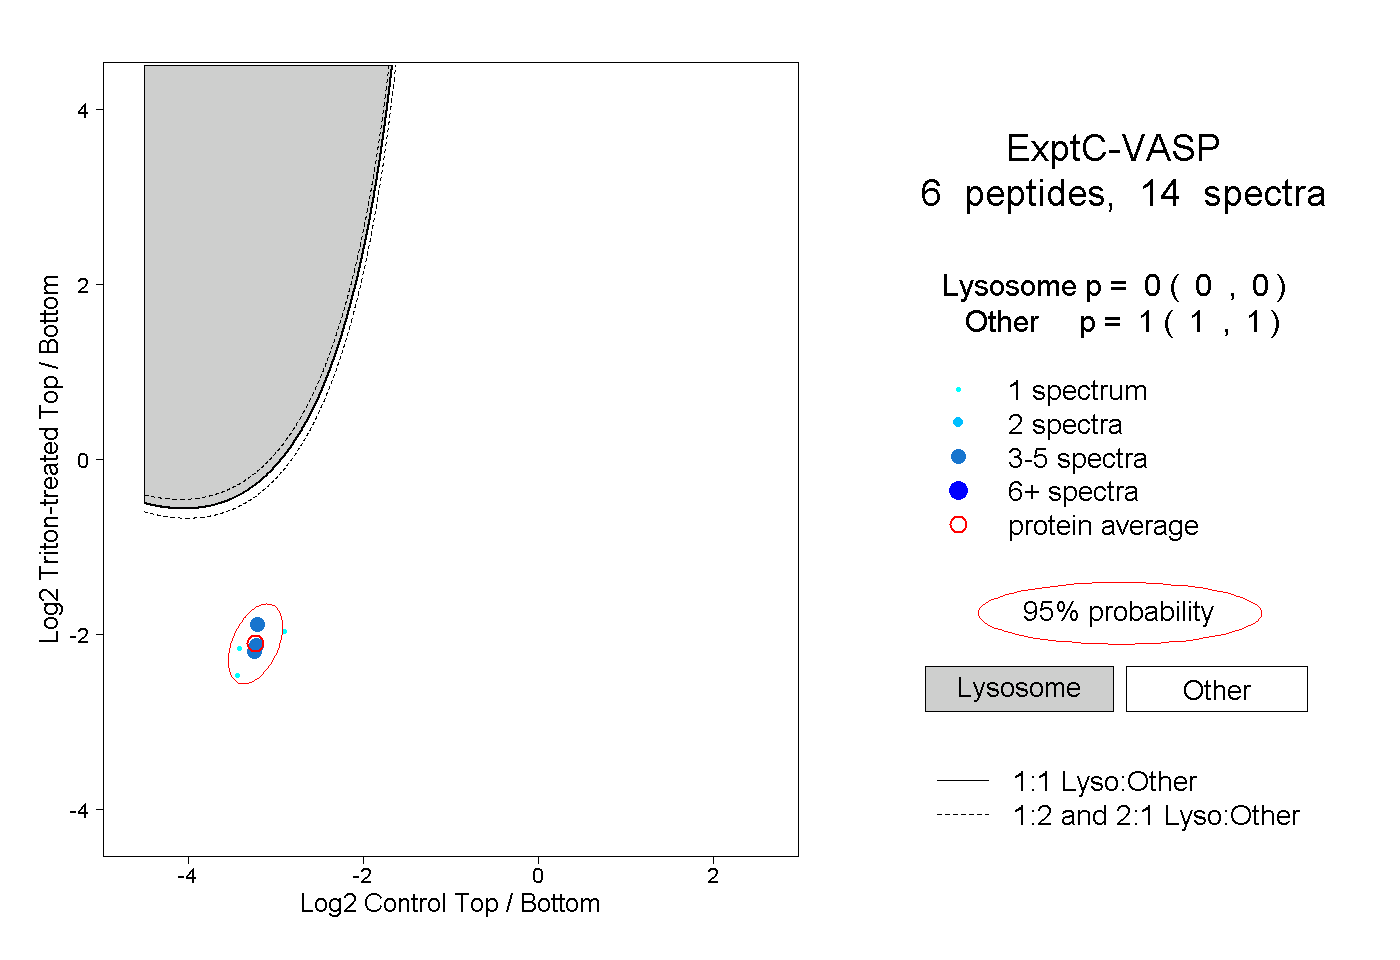
0.000 | 0.000
1.000 | 1.000
1peptide
spectrum
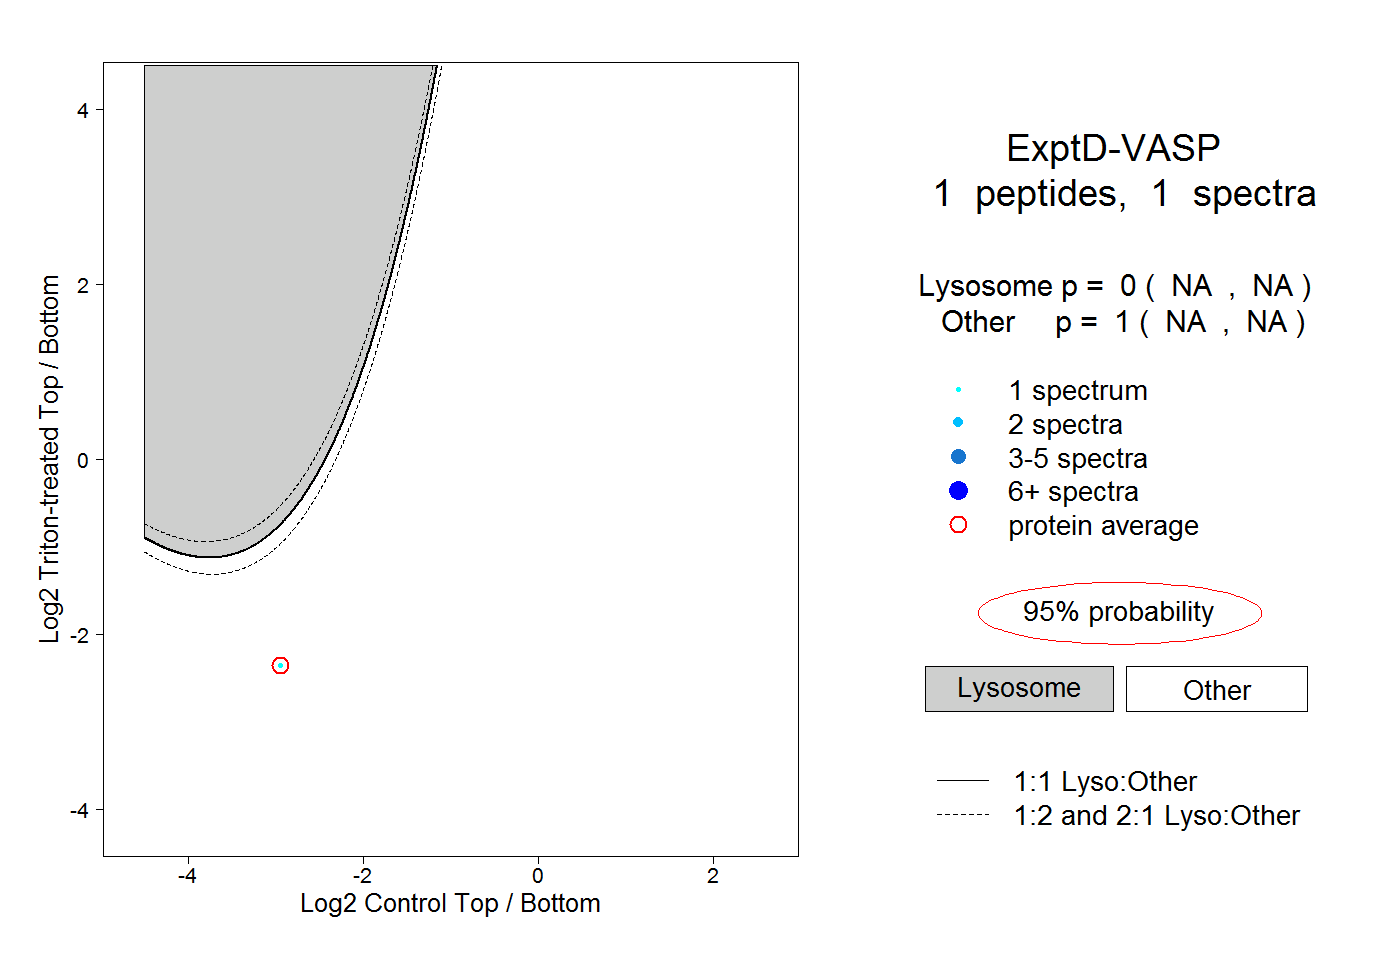
NA | NA
NA | NA