 5
5peptides
spectra
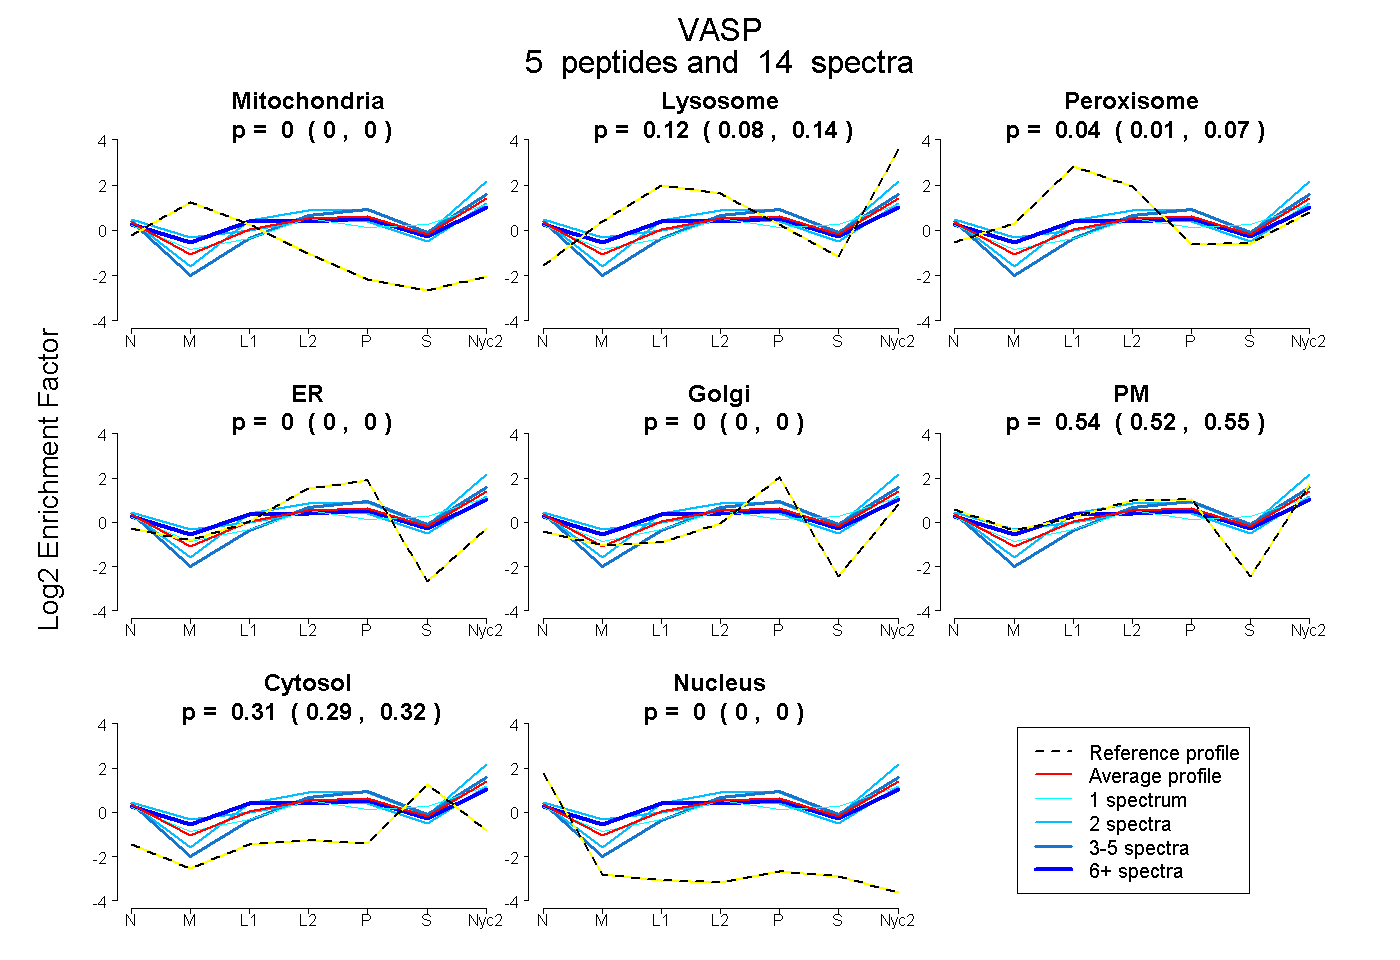
0.000 | 0.000
0.082 | 0.143
0.008 | 0.072
0.000 | 0.000
0.000 | 0.000
0.521 | 0.551
0.291 | 0.318
0.000 | 0.000
| Plot | Mito | Lyso | Perox | ER | Golgi | PM | Cytosol | Nucleus | |||||
| Expt A |
5 peptides |
14 spectra |
|
0.000 0.000 | 0.000 |
0.116 0.082 | 0.143 |
0.041 0.008 | 0.072 |
0.000 0.000 | 0.000 |
0.000 0.000 | 0.000 |
0.537 0.521 | 0.551 |
0.306 0.291 | 0.318 |
0.000 0.000 | 0.000 |
| 2 spectra, IPAQSEPVR | 0.000 | 0.252 | 0.000 | 0.000 | 0.000 | 0.500 | 0.248 | 0.000 | ||
| 6 spectra, VQIYHNPTANSFR | 0.000 | 0.016 | 0.212 | 0.000 | 0.000 | 0.504 | 0.268 | 0.000 | ||
| 2 spectra, QVWGLNFGSK | 0.000 | 0.018 | 0.130 | 0.000 | 0.000 | 0.599 | 0.254 | 0.000 | ||
| 3 spectra, QPEHLER | 0.000 | 0.055 | 0.000 | 0.000 | 0.000 | 0.599 | 0.346 | 0.000 | ||
| 1 spectrum, YNQATPIFHQWR | 0.000 | 0.100 | 0.077 | 0.000 | 0.000 | 0.430 | 0.393 | 0.000 |
| Plot | Lyso | Other | |||||||||||
| Expt C |
6 peptides |
14 spectra |
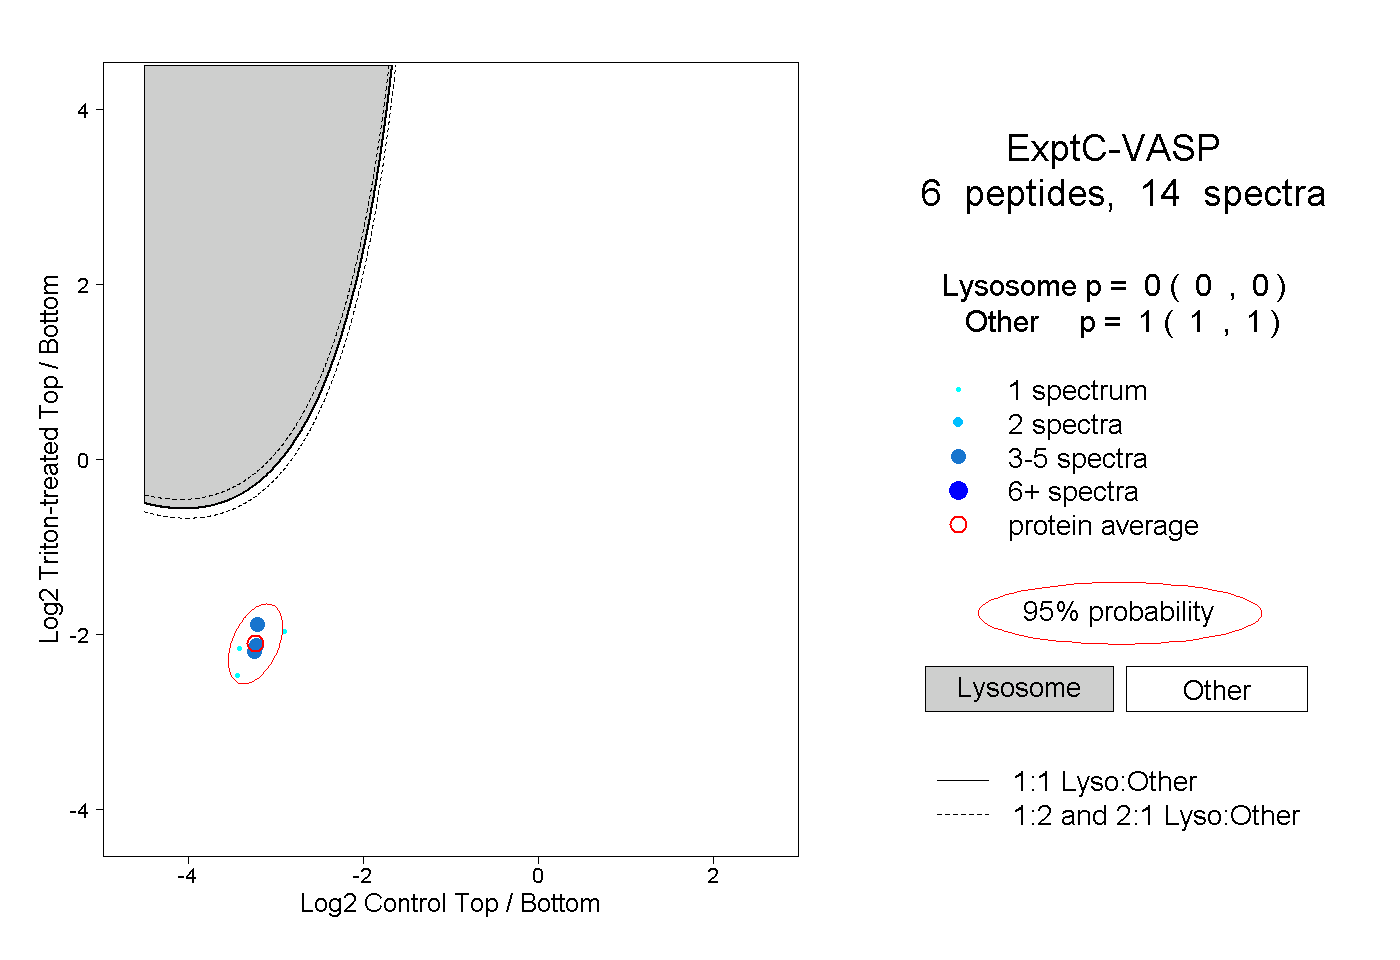 |
0.000 0.000 | 0.000 |
1.000 1.000 | 1.000 |
||||||||
| Plot | Lyso | Other | |||||||||||
| Expt D |
1 peptide |
1 spectrum |
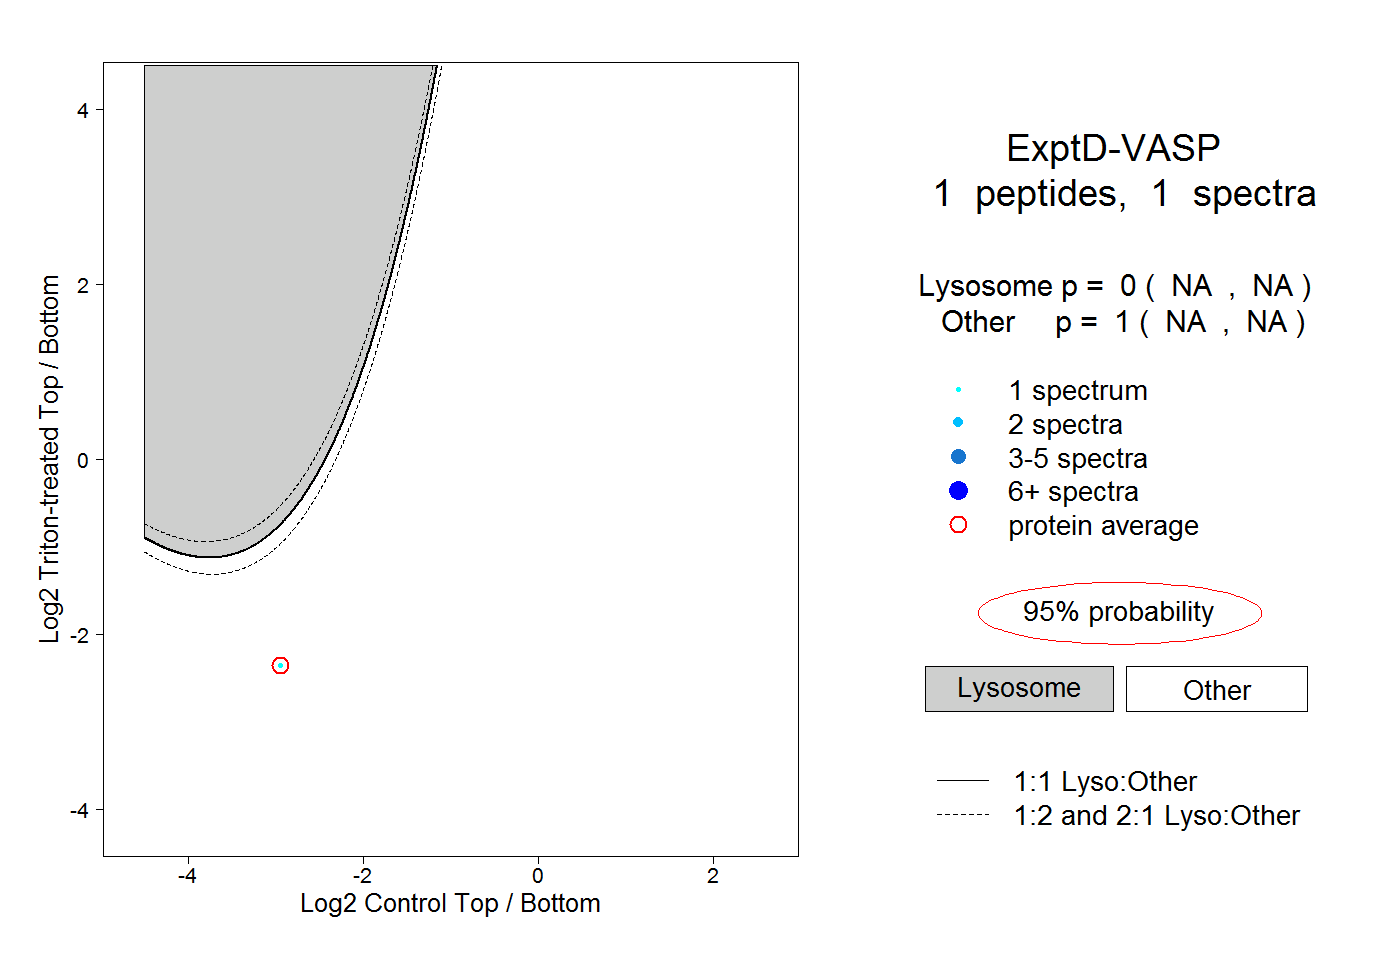 |
0.000 NA | NA |
1.000 NA | NA |