 3
3peptides
spectra
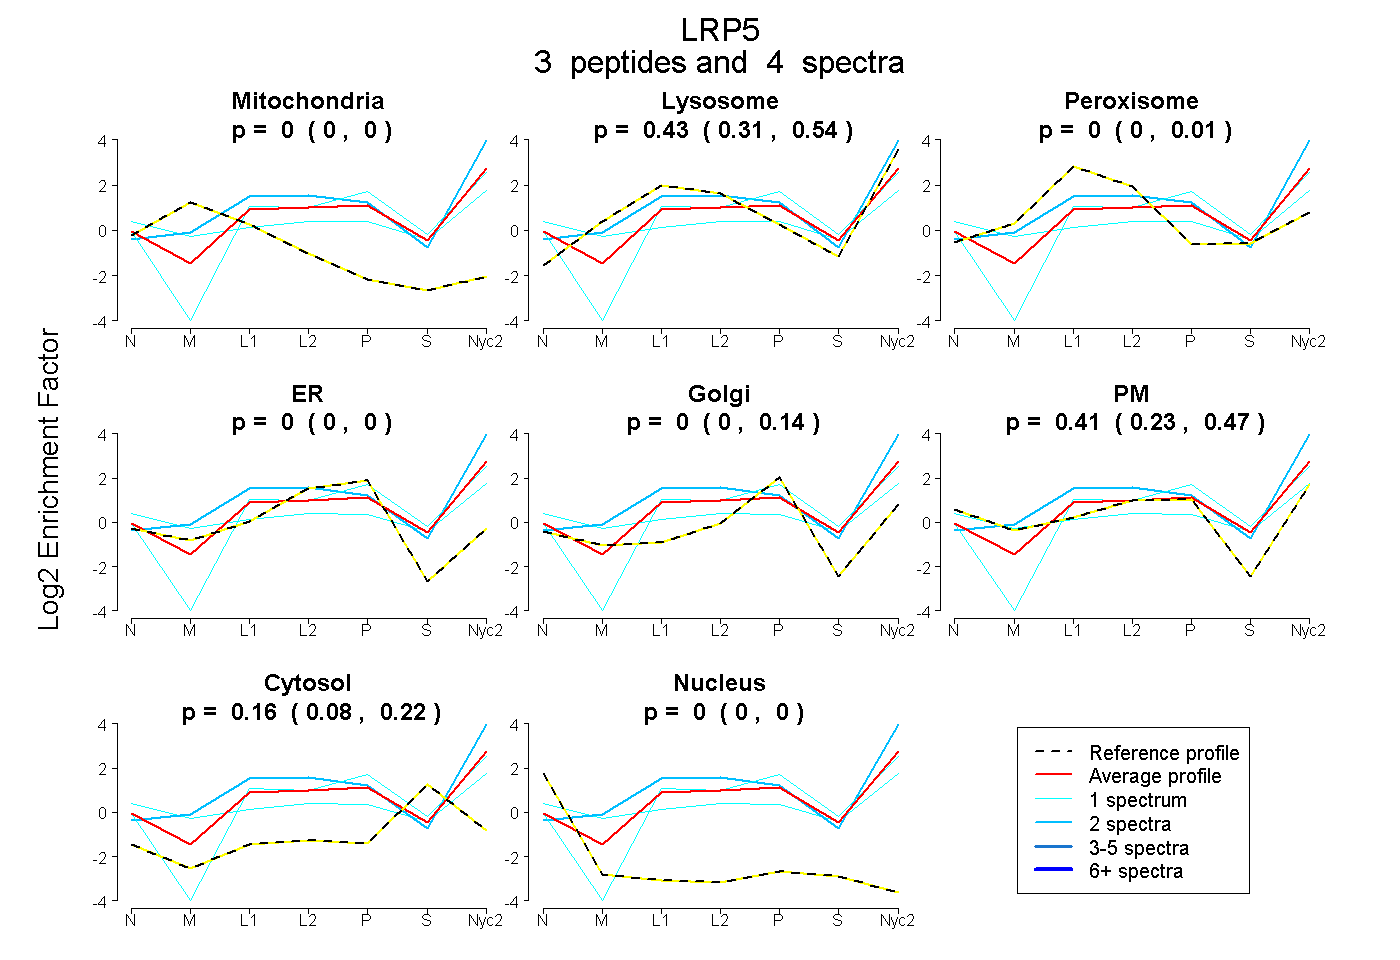
0.000 | 0.000
0.308 | 0.537
0.000 | 0.012
0.000 | 0.000
0.000 | 0.137
0.234 | 0.465
0.075 | 0.223
0.000 | 0.000
5peptides
spectra
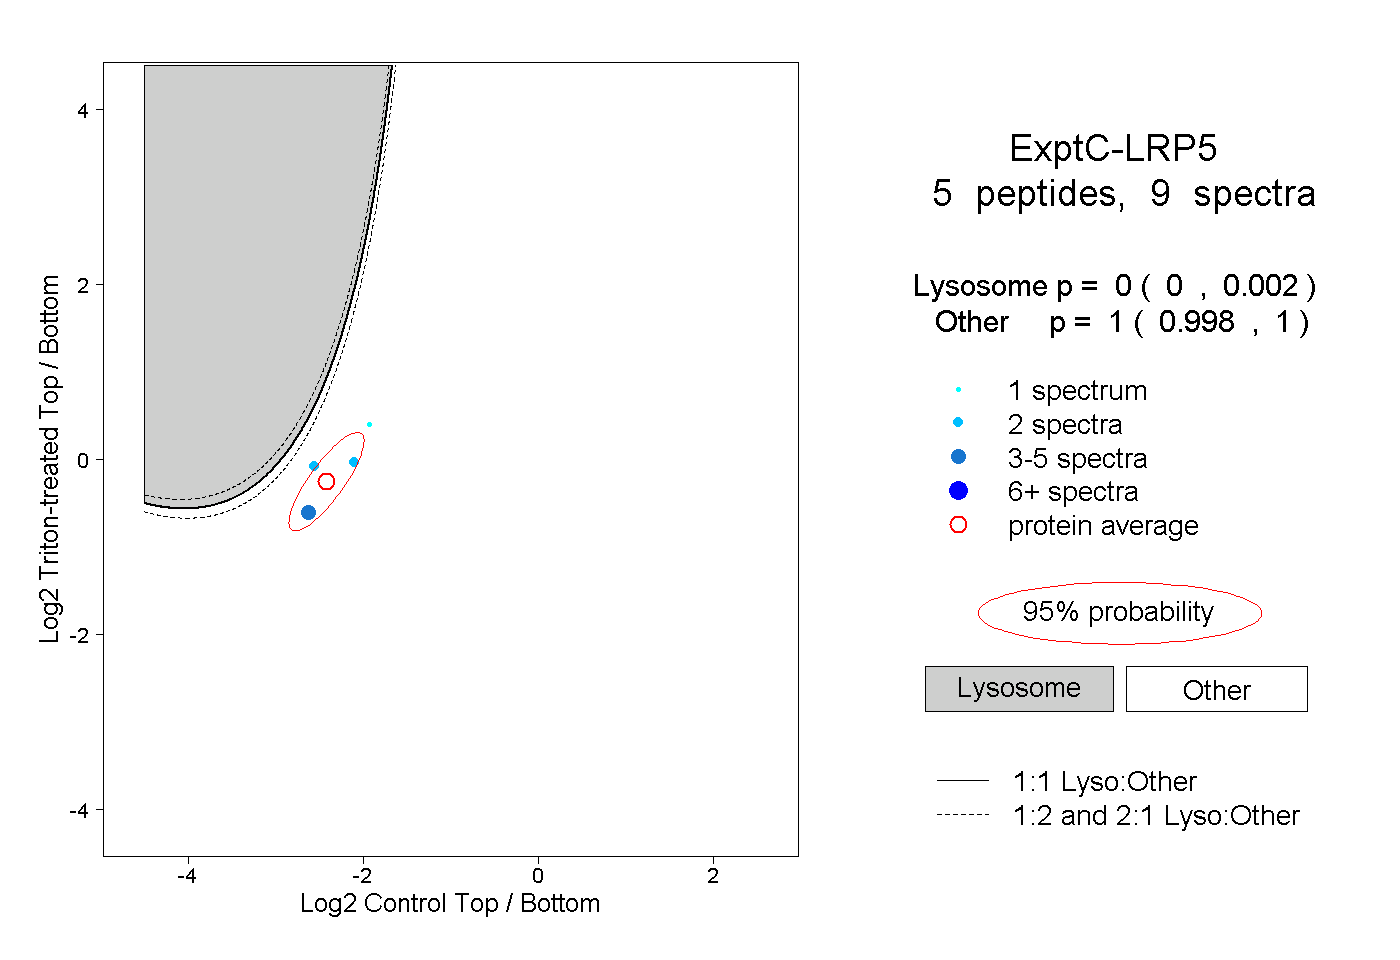
0.000 | 0.002
0.998 | 1.000
1peptide
spectra
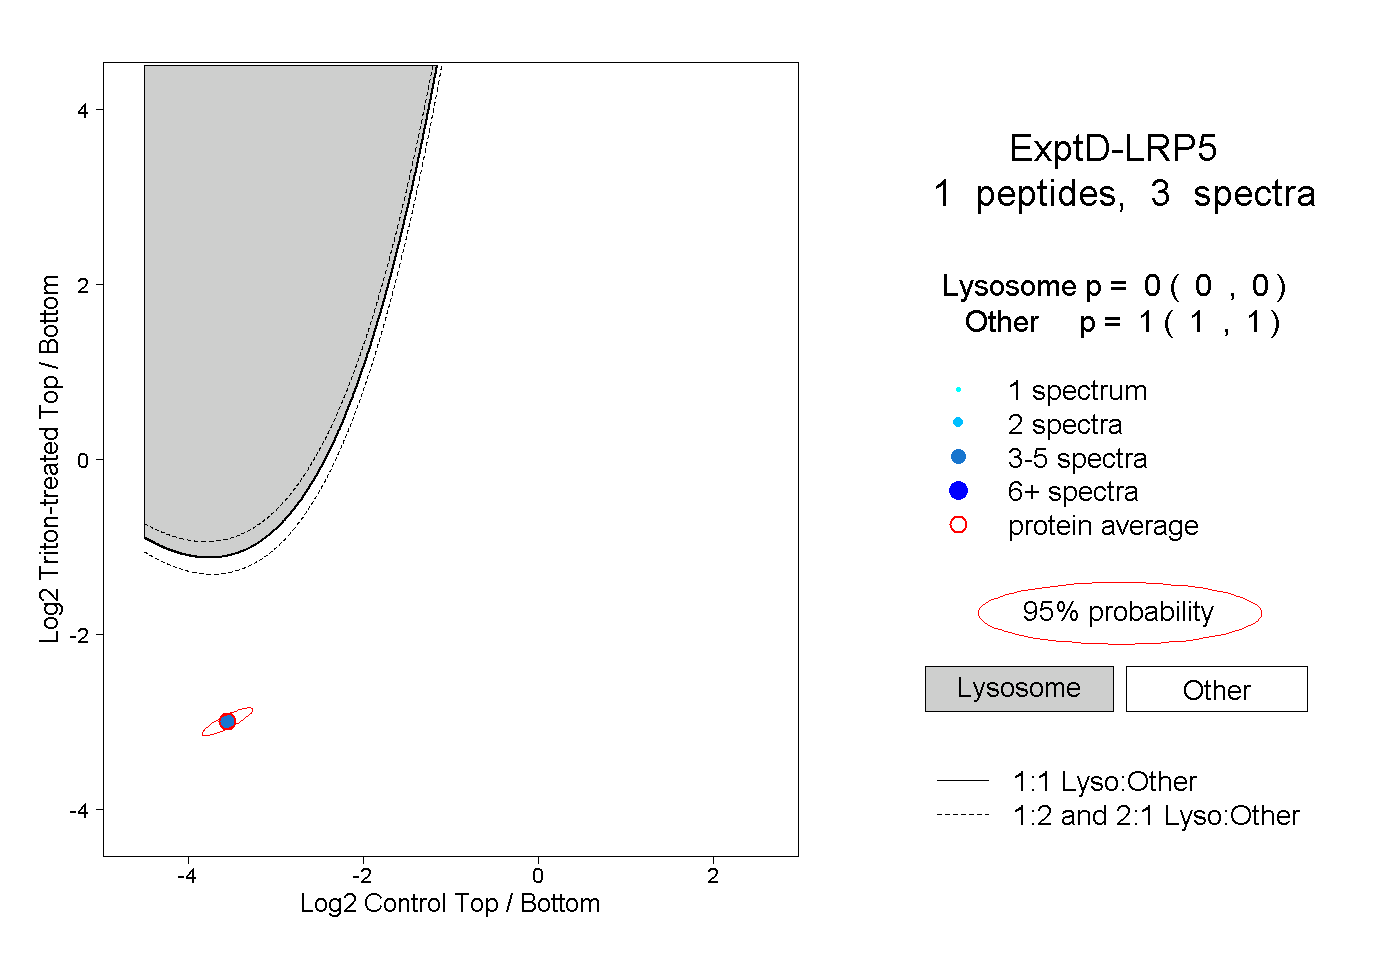
0.000 | 0.000
1.000 | 1.000