 3
3peptides
spectra
0.000 | 0.000
0.308 | 0.537
0.000 | 0.012
0.000 | 0.000
0.000 | 0.137
0.234 | 0.465
0.075 | 0.223
0.000 | 0.000
| Plot | Mito | Lyso | Perox | ER | Golgi | PM | Cytosol | Nucleus | |||||
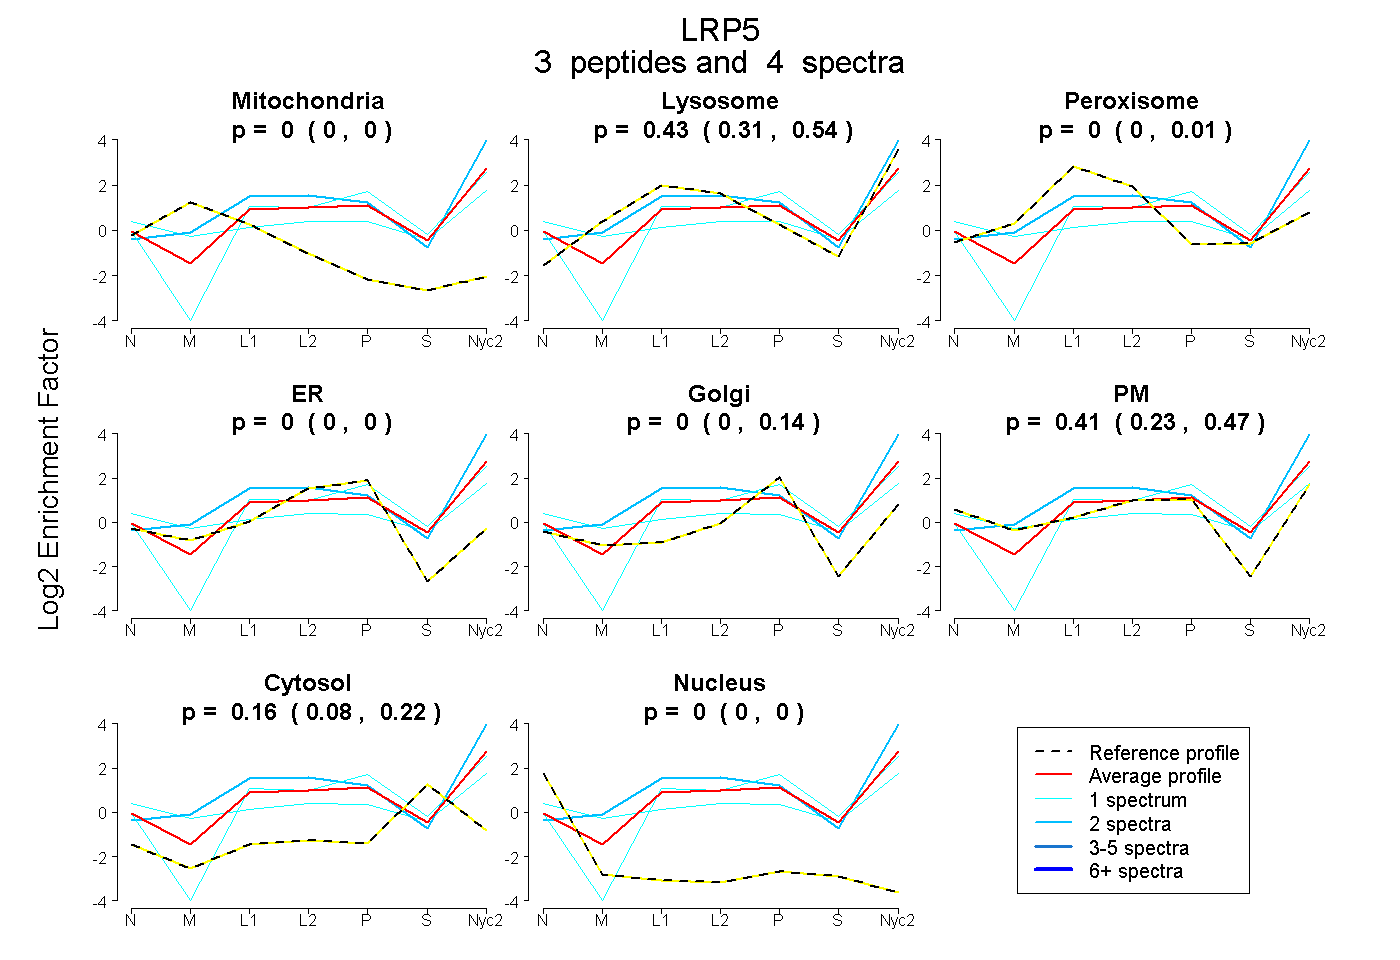
| Expt A |
3 peptides |
4 spectra |
|
0.000 0.000 | 0.000 |
0.430 0.308 | 0.537 |
0.000 0.000 | 0.012 |
0.000 0.000 | 0.000 |
0.000 0.000 | 0.137 |
0.408 0.234 | 0.465 |
0.162 0.075 | 0.223 |
0.000 0.000 | 0.000 |
| 2 spectra, LYWTDSETNR | 0.000 | 0.781 | 0.000 | 0.000 | 0.000 | 0.219 | 0.000 | 0.000 | ||
| 1 spectrum, MIPDDQLSPDLILPLHGLR | 0.000 | 0.339 | 0.000 | 0.000 | 0.254 | 0.166 | 0.241 | 0.000 | ||
| 1 spectrum, AGMDGSTR | 0.000 | 0.196 | 0.036 | 0.000 | 0.000 | 0.526 | 0.243 | 0.000 |
| Plot | Lyso | Other | |||||||||||
| Expt C |
5 peptides |
9 spectra |
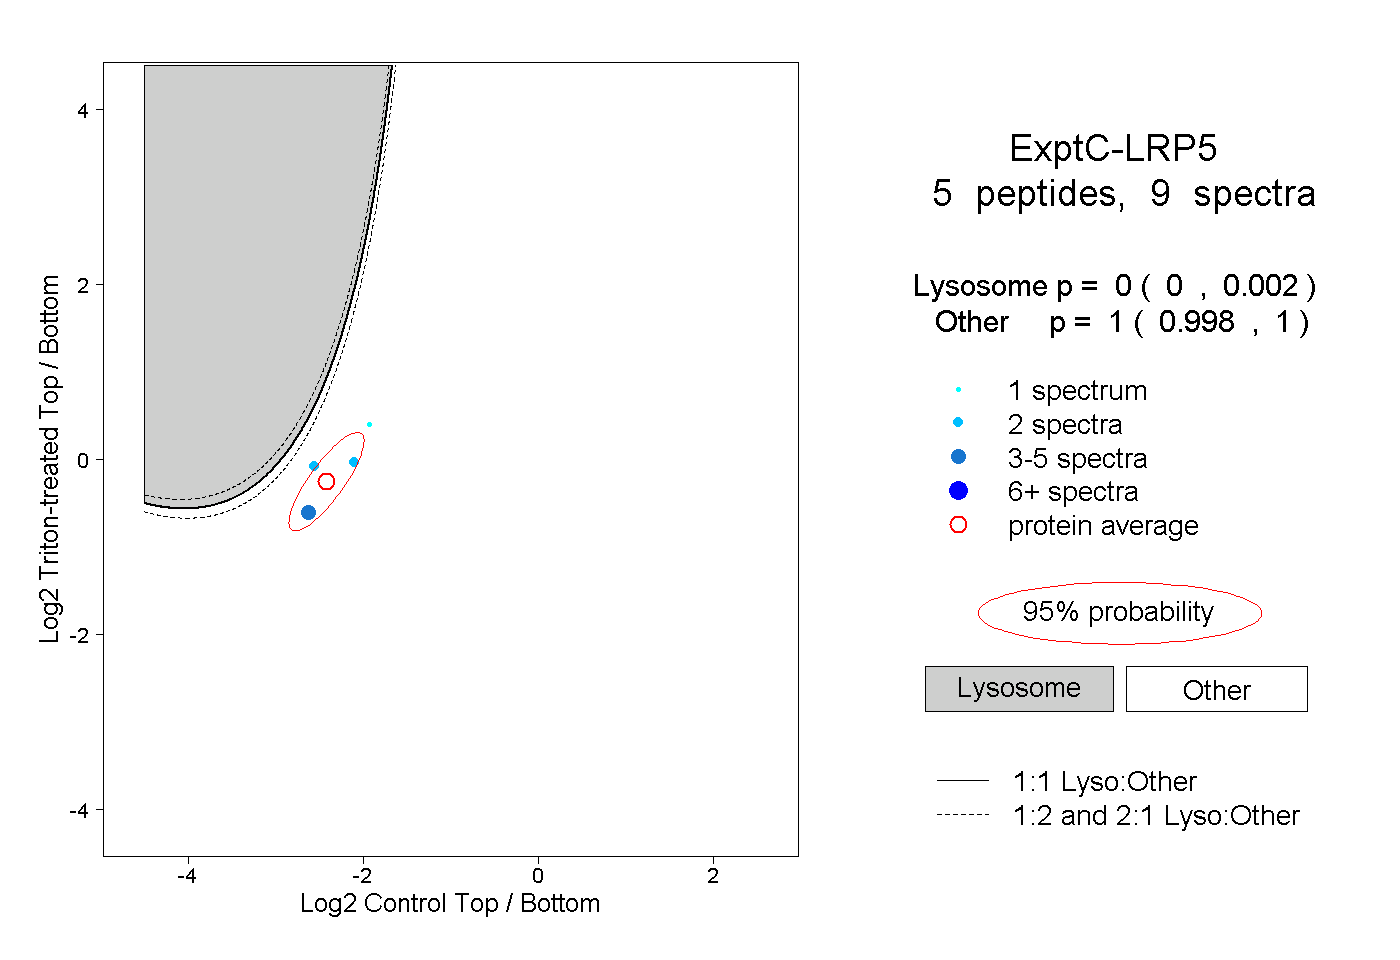 |
0.000 0.000 | 0.002 |
1.000 0.998 | 1.000 |
||||||||
| Plot | Lyso | Other | |||||||||||
| Expt D |
1 peptide |
3 spectra |
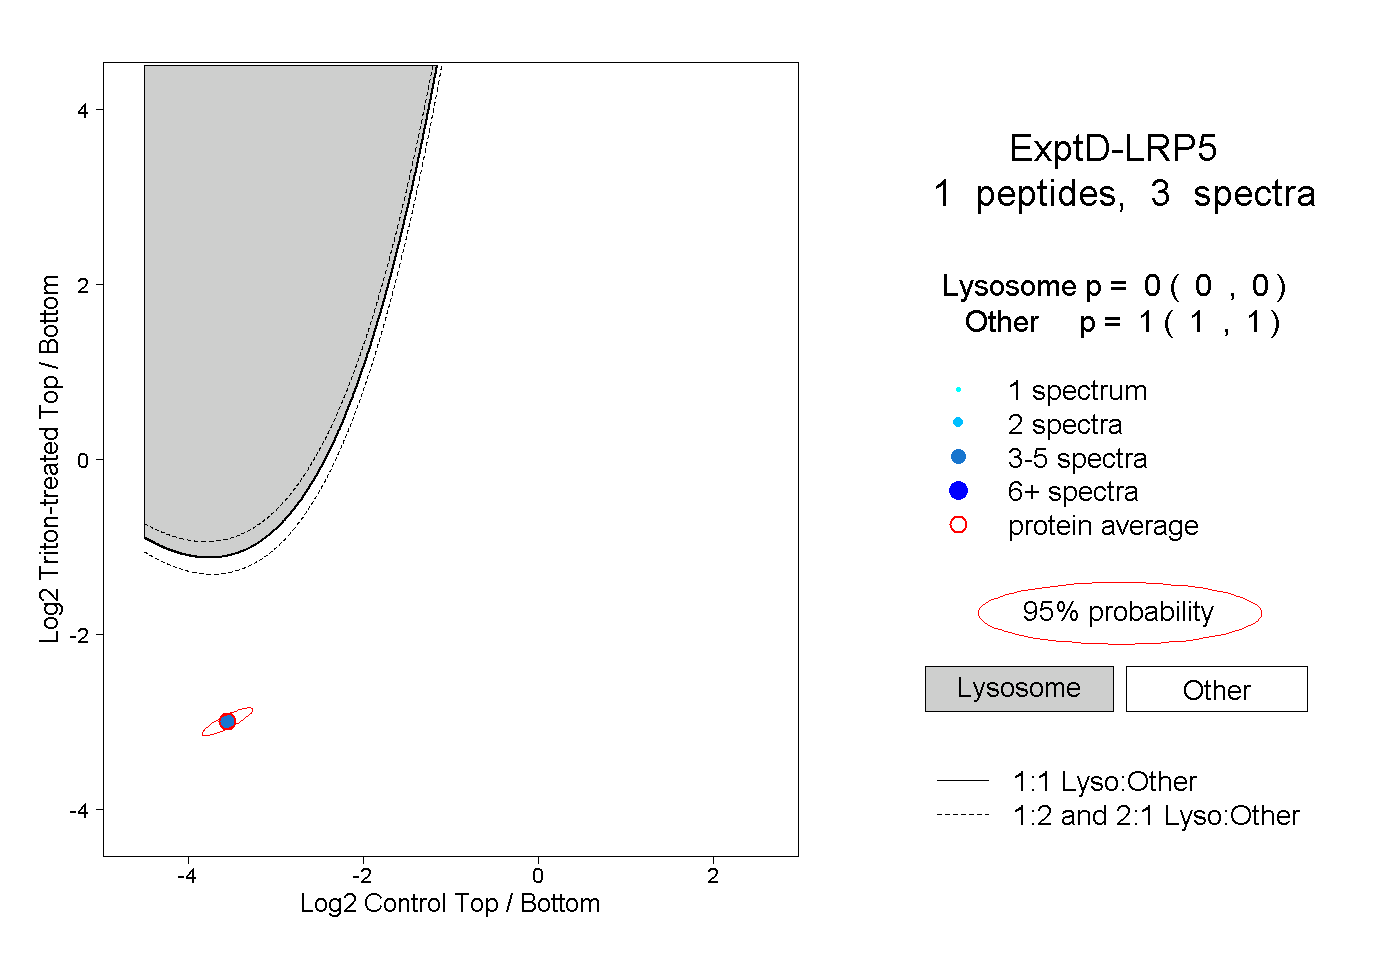 |
0.000 0.000 | 0.000 |
1.000 1.000 | 1.000 |