 3
3peptides
spectra
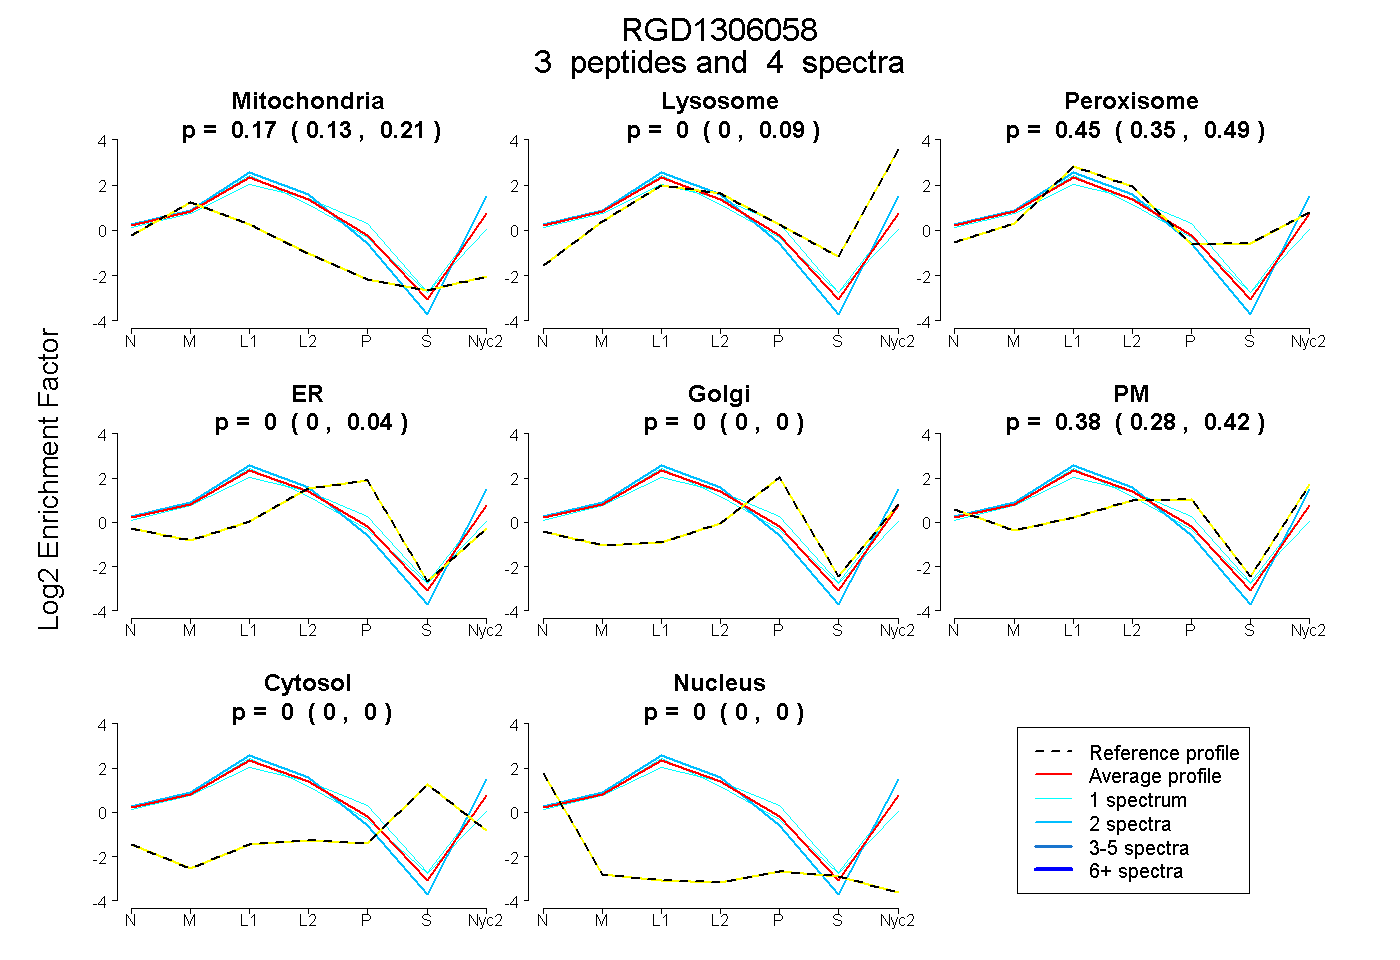
0.132 | 0.214
0.000 | 0.091
0.354 | 0.491
0.000 | 0.043
0.000 | 0.000
0.277 | 0.415
0.000 | 0.000
0.000 | 0.000
2peptides
spectra
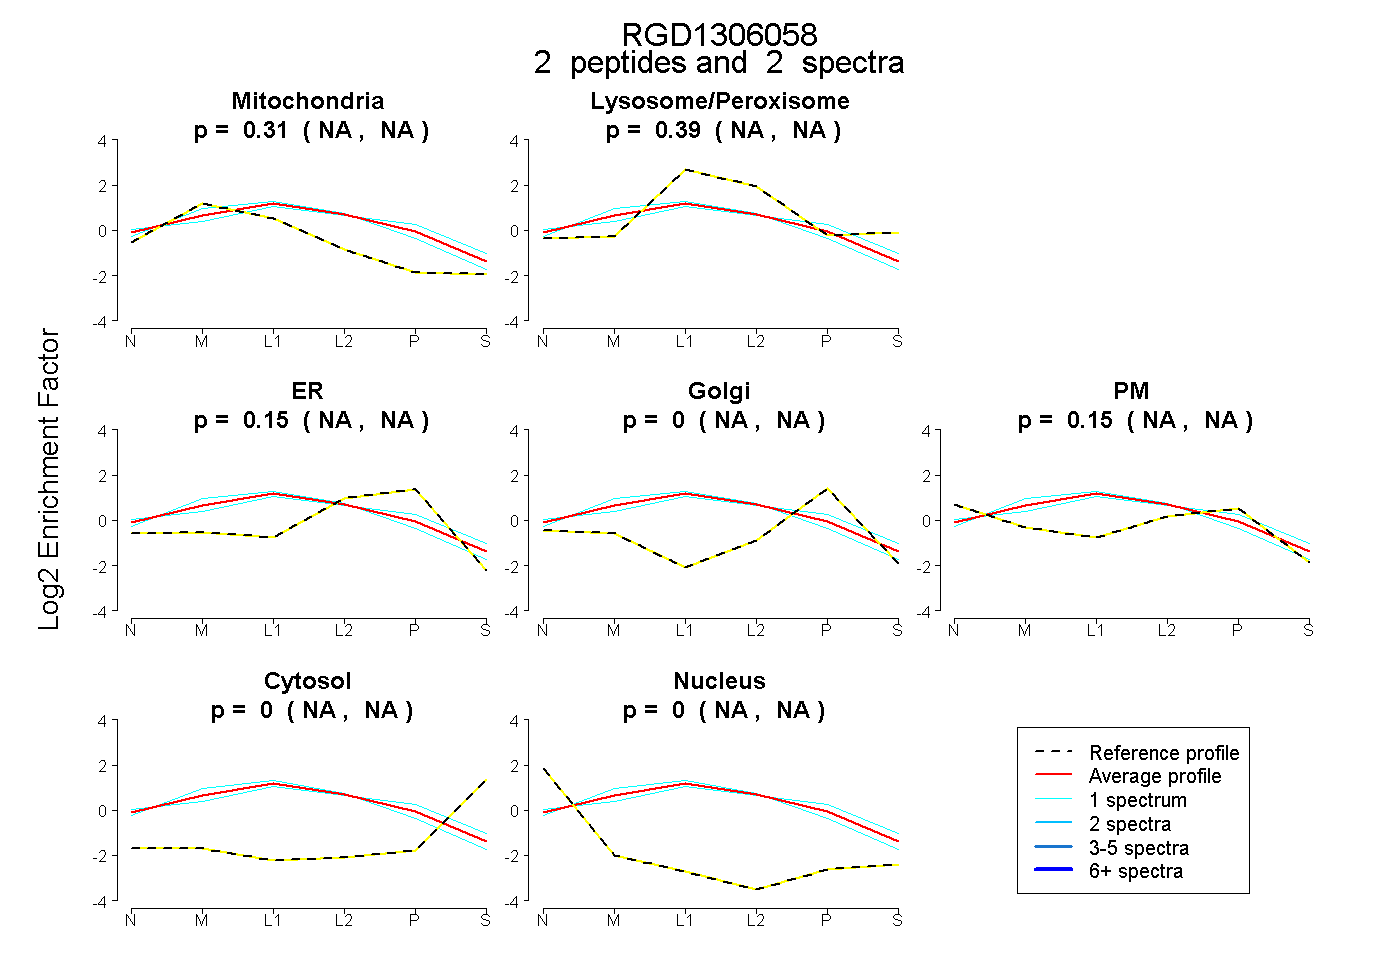
NA | NA
NA | NA
NA | NA
NA | NA
NA | NA
NA | NA
NA | NA
8peptides
spectra
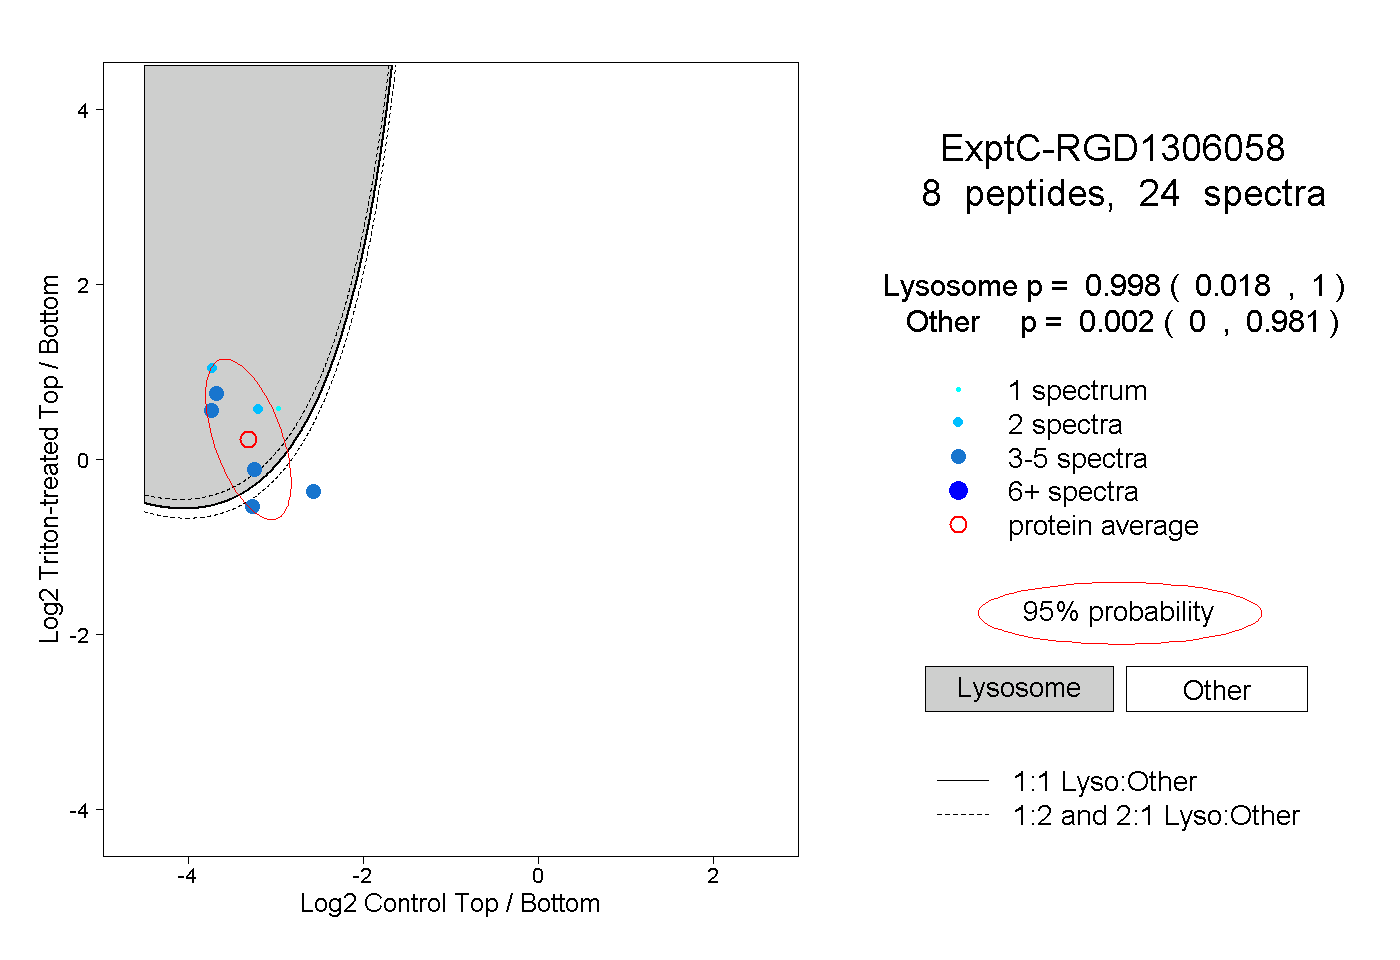
0.018 | 1.000
0.000 | 0.981