 3
3peptides
spectra
0.132 | 0.214
0.000 | 0.091
0.354 | 0.491
0.000 | 0.043
0.000 | 0.000
0.277 | 0.415
0.000 | 0.000
0.000 | 0.000
| Plot | Mito | Lyso | Perox | ER | Golgi | PM | Cytosol | Nucleus | |||||
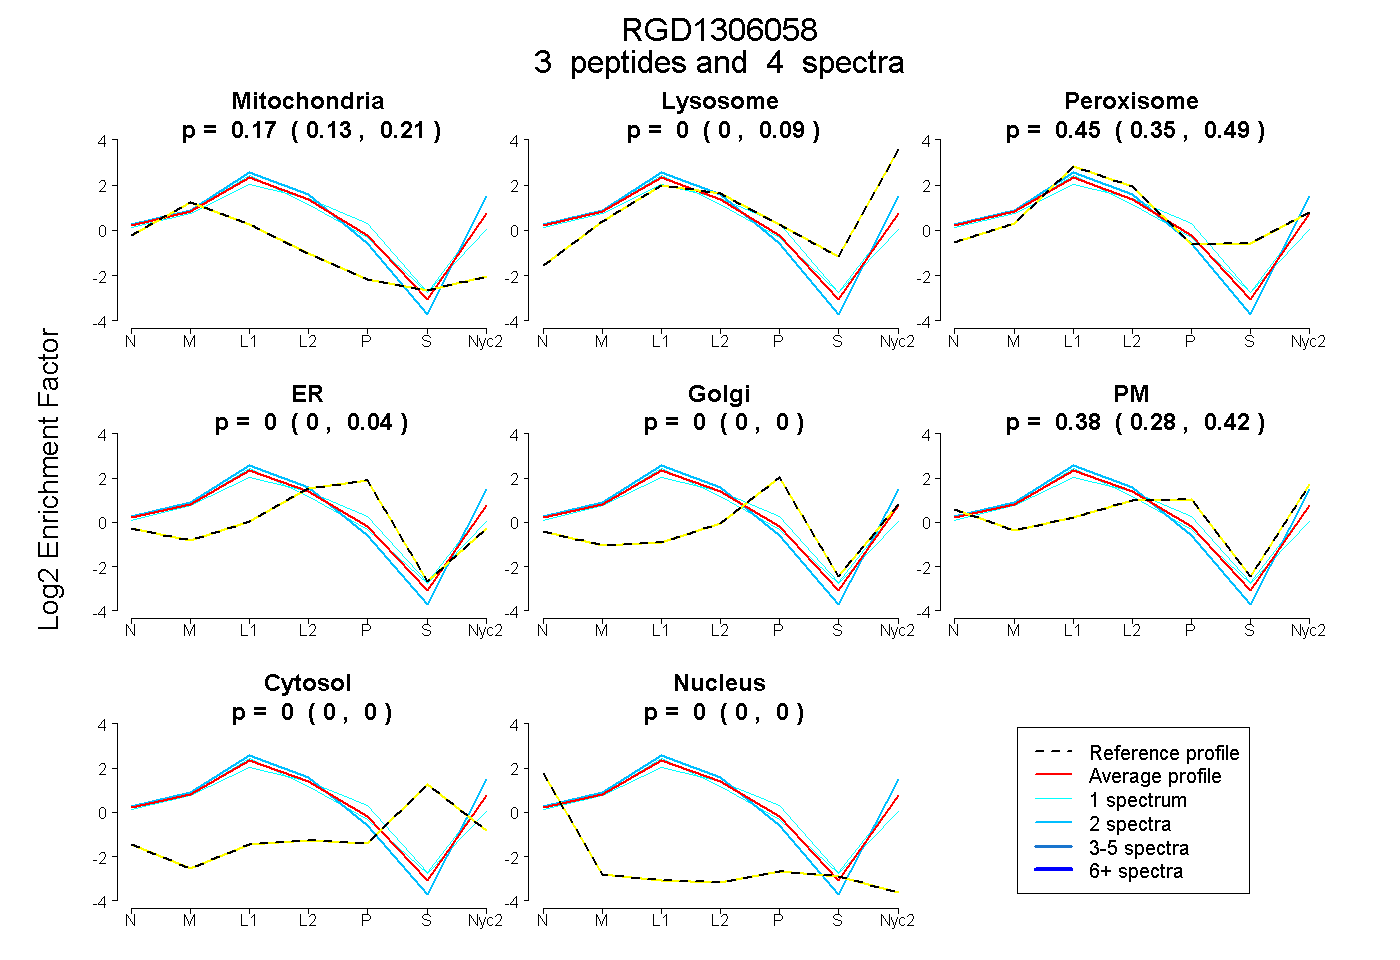
| Expt A |
3 peptides |
4 spectra |
|
0.169 0.132 | 0.214 |
0.000 0.000 | 0.091 |
0.454 0.354 | 0.491 |
0.000 0.000 | 0.043 |
0.000 0.000 | 0.000 |
0.377 0.277 | 0.415 |
0.000 0.000 | 0.000 |
0.000 0.000 | 0.000 |
| 1 spectrum, LCDLLSHLQQR | 0.260 | 0.000 | 0.488 | 0.059 | 0.000 | 0.193 | 0.000 | 0.000 | ||
| 2 spectra, VLAFSPVIIDR | 0.175 | 0.202 | 0.294 | 0.000 | 0.000 | 0.329 | 0.000 | 0.000 | ||
| 1 spectrum, ELDWGIER | 0.121 | 0.006 | 0.418 | 0.080 | 0.000 | 0.374 | 0.000 | 0.000 |
| Plot | Mito | Lyso or Perox | ER | Golgi | PM | Cytosol | Nucleus | ||||||
| Expt B |
2 peptides |
2 spectra |
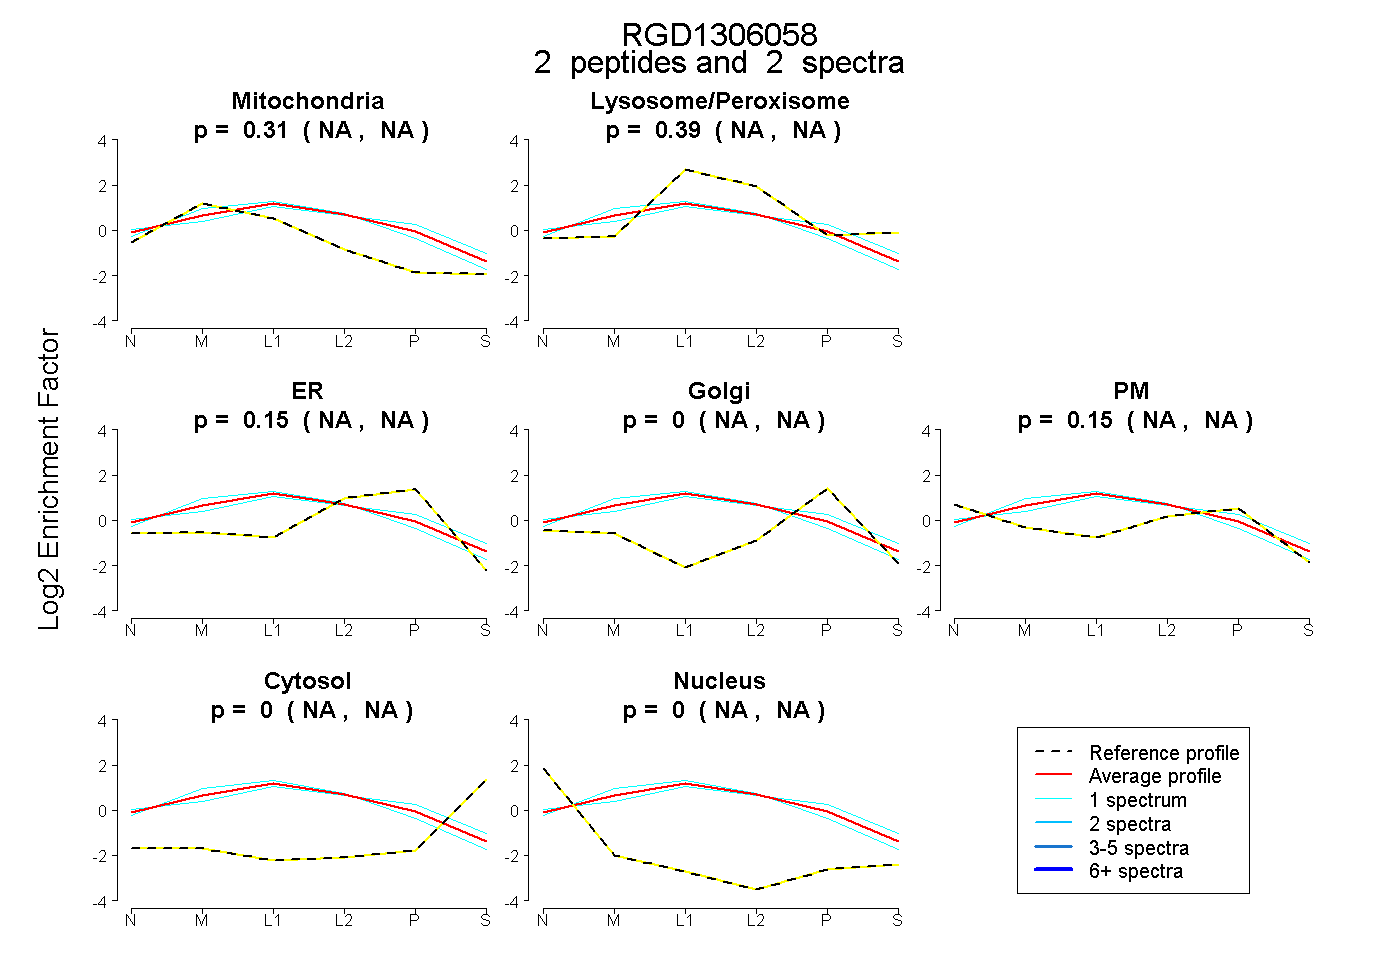 |
0.307 NA | NA |
0.395 NA | NA |
0.148 NA | NA |
0.000 NA | NA |
0.150 NA | NA |
0.000 NA | NA |
0.000 NA | NA |
|||
| Plot | Lyso | Other | |||||||||||
| Expt C |
8 peptides |
24 spectra |
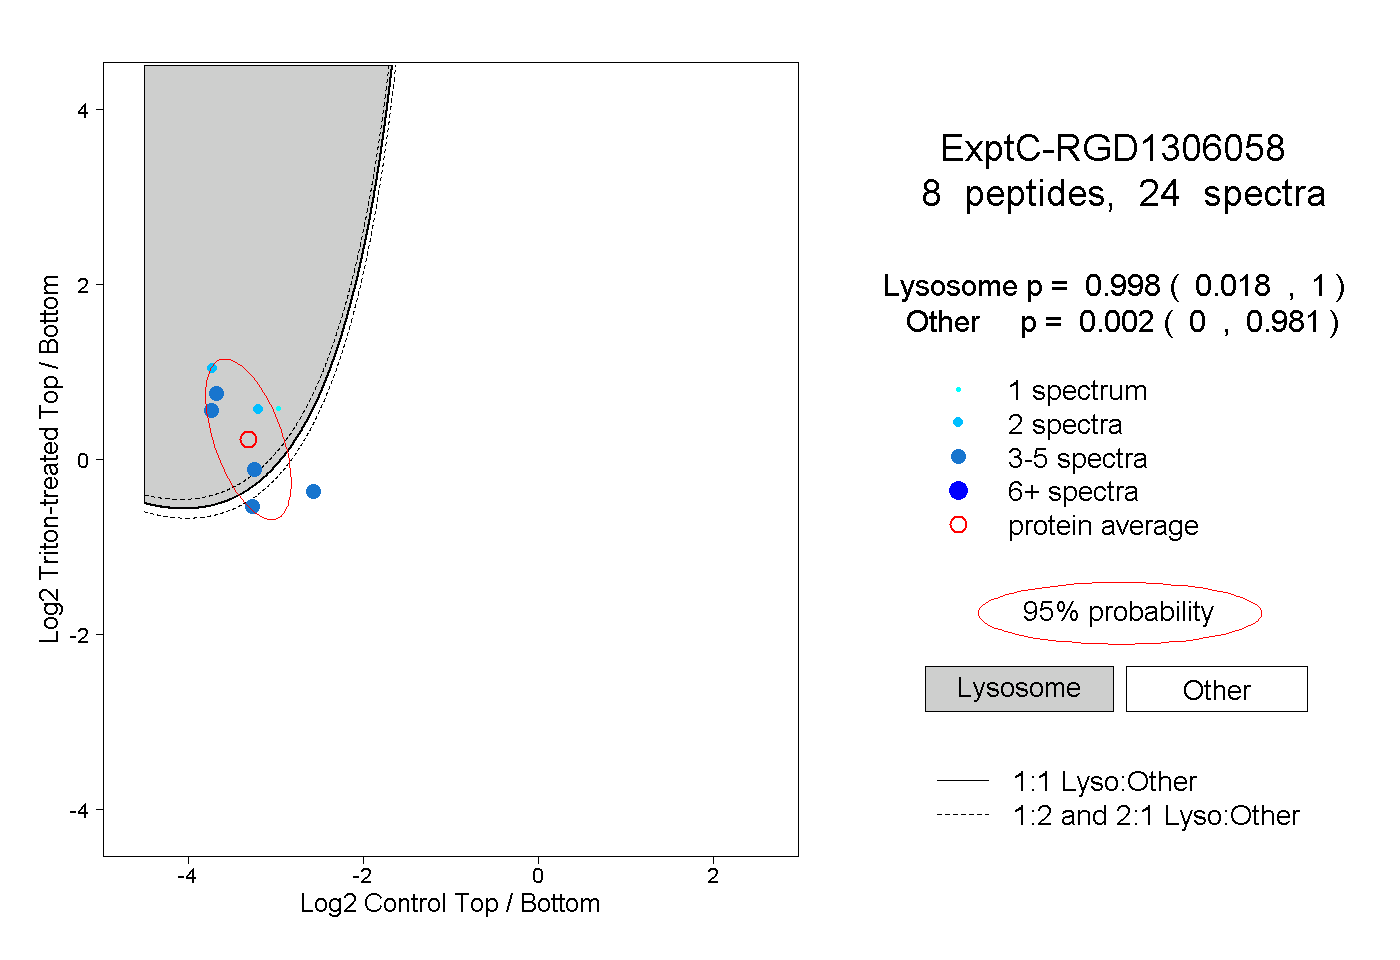 |
0.998 0.018 | 1.000 |
0.002 0.000 | 0.981 |