 8
8peptides
spectra
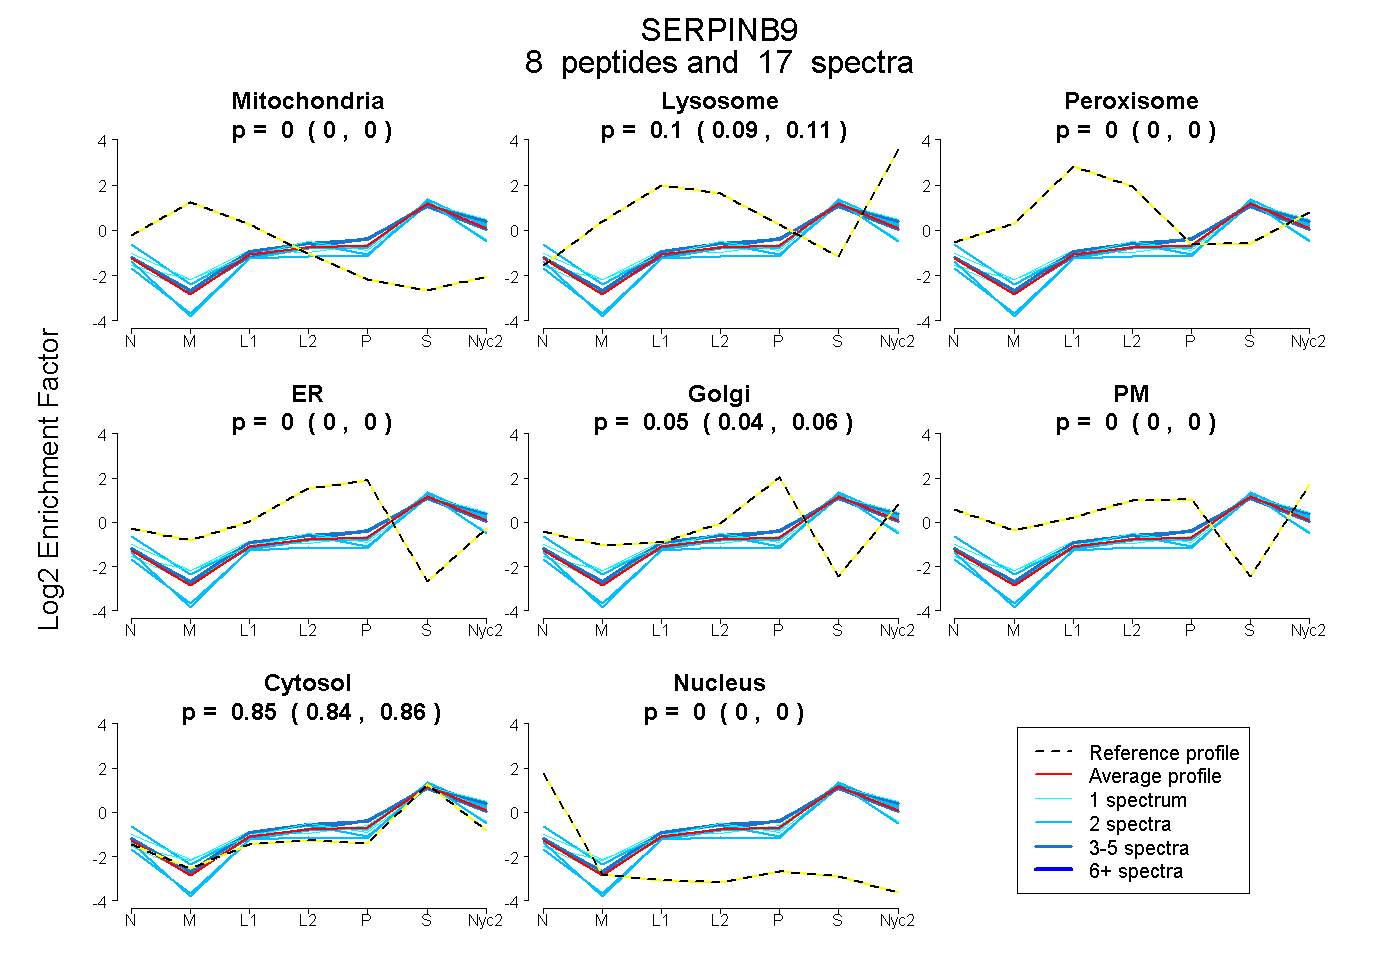
0.000 | 0.000
0.090 | 0.108
0.000 | 0.000
0.000 | 0.000
0.037 | 0.061
0.000 | 0.000
0.840 | 0.858
0.000 | 0.000
3peptides
spectra
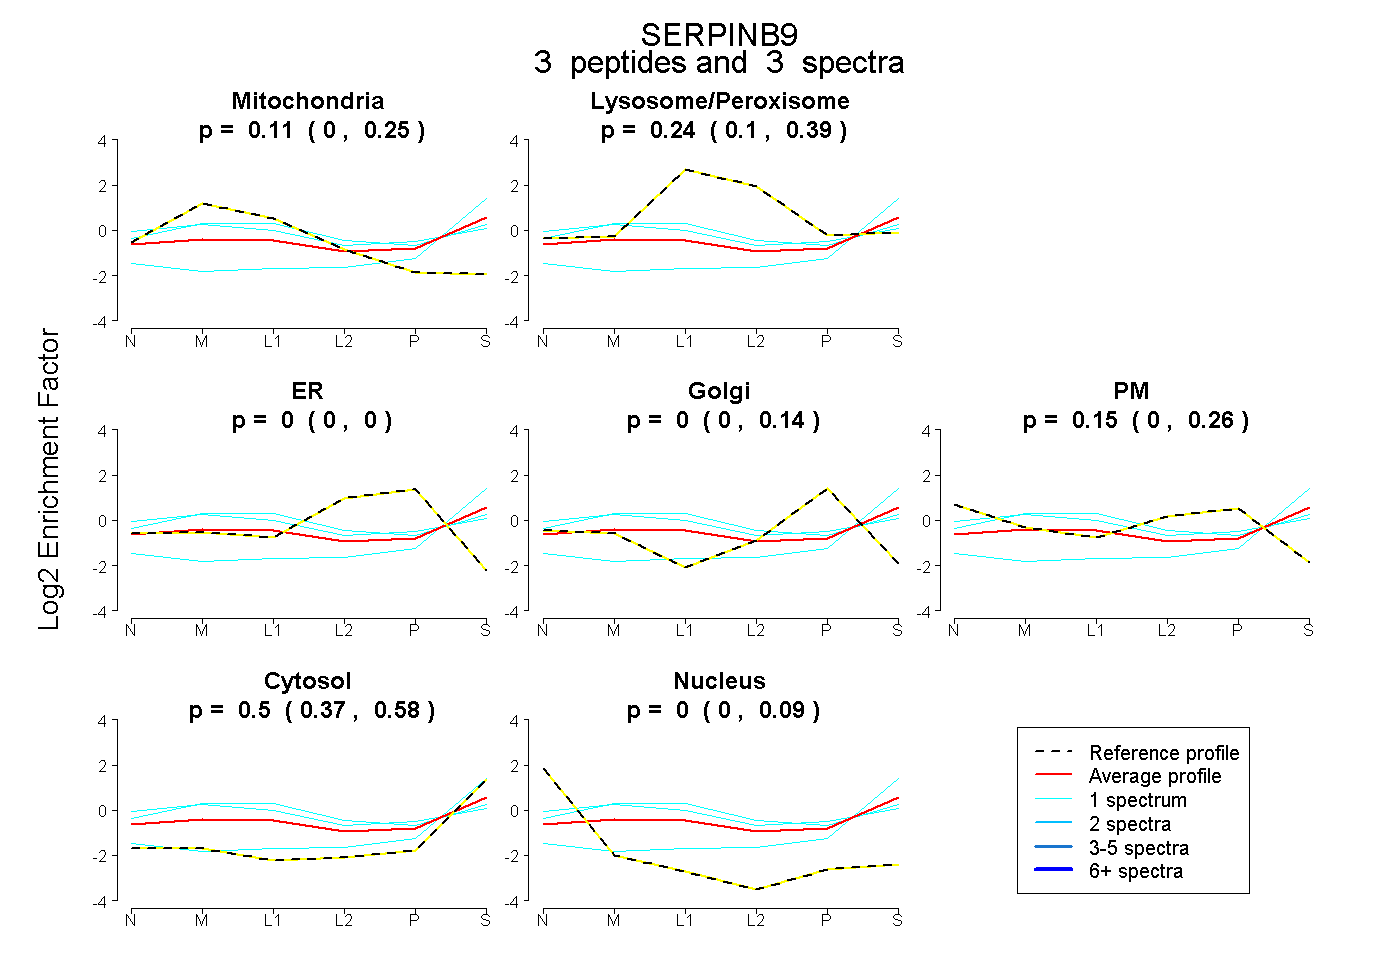
0.000 | 0.255
0.103 | 0.388
0.000 | 0.000
0.000 | 0.138
0.000 | 0.261
0.374 | 0.579
0.000 | 0.090
5peptides
spectra
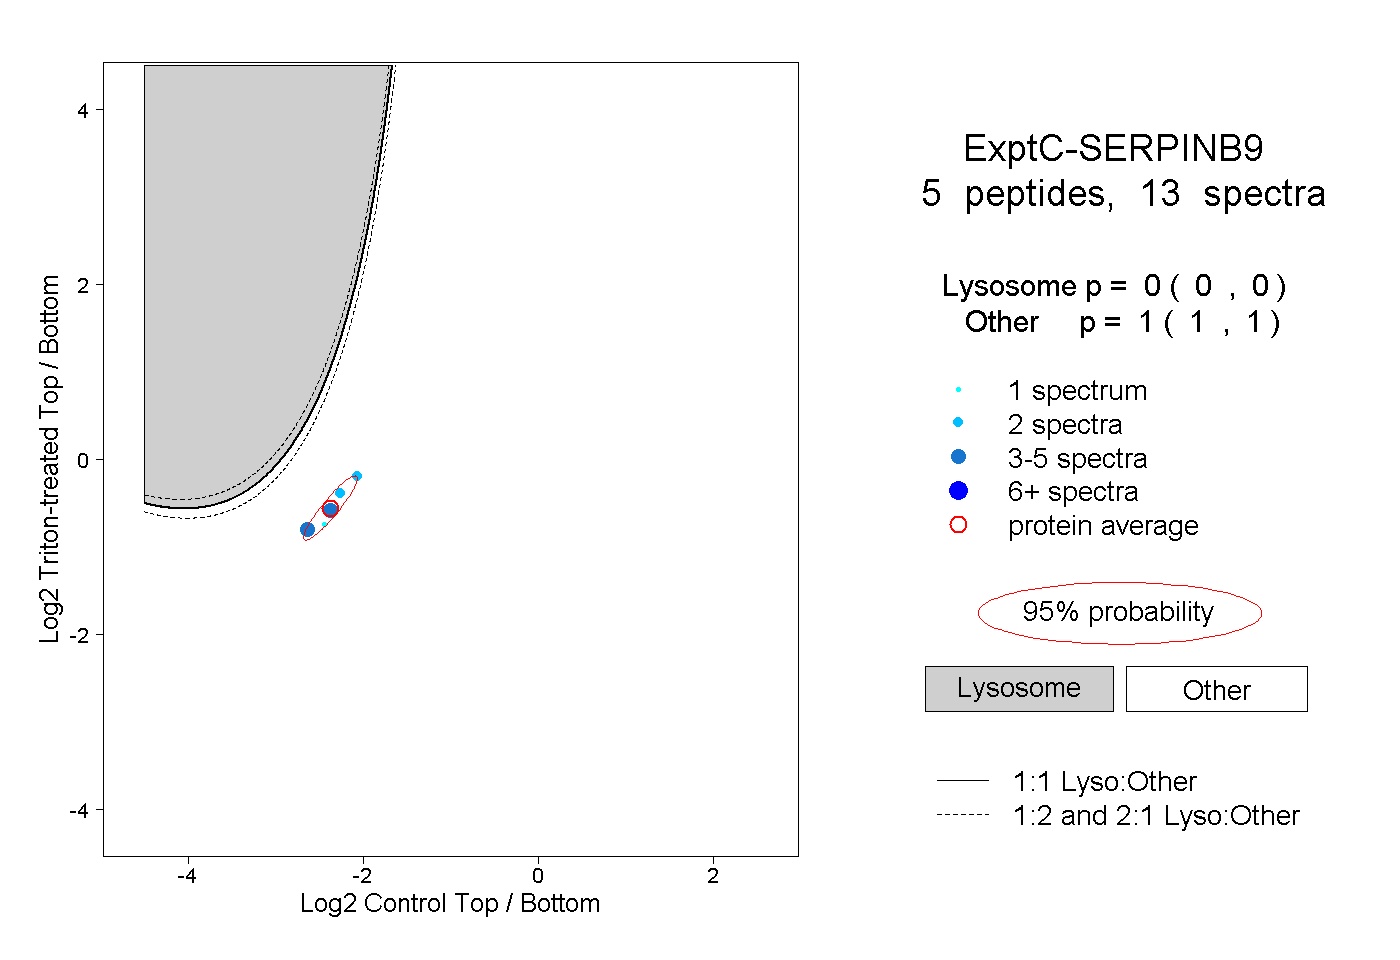
0.000 | 0.000
1.000 | 1.000