 8
8peptides
spectra
0.000 | 0.000
0.090 | 0.108
0.000 | 0.000
0.000 | 0.000
0.037 | 0.061
0.000 | 0.000
0.840 | 0.858
0.000 | 0.000
| Plot | Mito | Lyso | Perox | ER | Golgi | PM | Cytosol | Nucleus | |||||
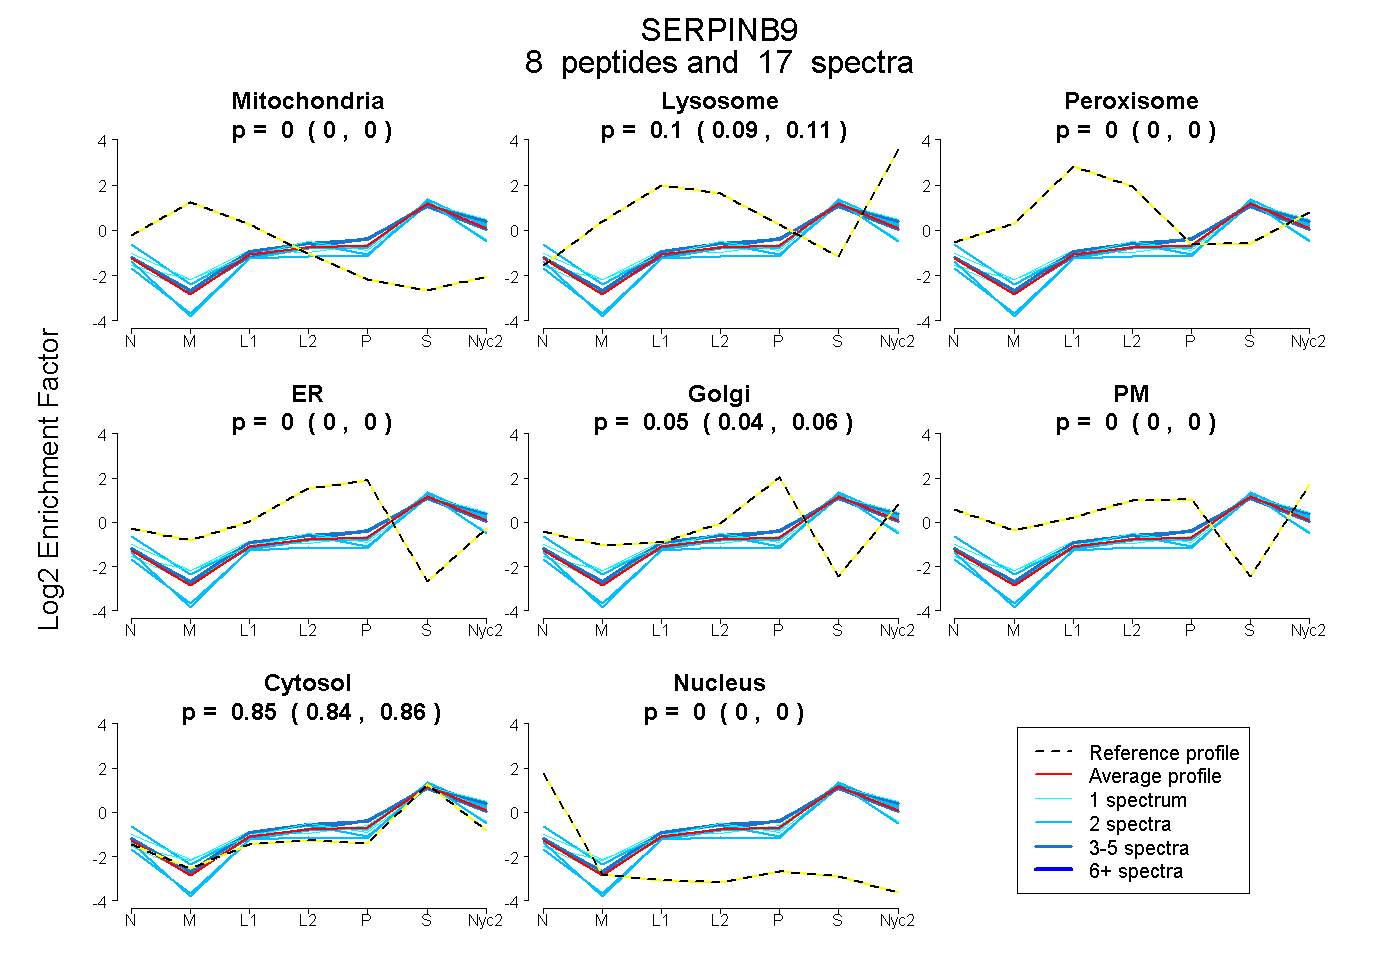
| Expt A |
8 peptides |
17 spectra |
|
0.000 0.000 | 0.000 |
0.100 0.090 | 0.108 |
0.000 0.000 | 0.000 |
0.000 0.000 | 0.000 |
0.050 0.037 | 0.061 |
0.000 0.000 | 0.000 |
0.850 0.840 | 0.858 |
0.000 0.000 | 0.000 |
| 2 spectra, TCELLPTYK | 0.000 | 0.000 | 0.000 | 0.025 | 0.017 | 0.000 | 0.958 | 0.000 | ||
| 1 spectrum, LTAWTNPDFMK | 0.000 | 0.137 | 0.000 | 0.000 | 0.000 | 0.000 | 0.863 | 0.000 | ||
| 5 spectra, LGIVDVFQEAK | 0.000 | 0.070 | 0.000 | 0.000 | 0.125 | 0.000 | 0.805 | 0.000 | ||
| 2 spectra, IPELLSGGSVDSETR | 0.000 | 0.040 | 0.000 | 0.000 | 0.000 | 0.000 | 0.960 | 0.000 | ||
| 3 spectra, VESNLTFEK | 0.000 | 0.154 | 0.000 | 0.000 | 0.065 | 0.000 | 0.781 | 0.000 | ||
| 1 spectrum, WHQPFNK | 0.000 | 0.176 | 0.000 | 0.000 | 0.000 | 0.031 | 0.793 | 0.000 | ||
| 1 spectrum, LQEDYDMESVFQR | 0.000 | 0.106 | 0.000 | 0.012 | 0.026 | 0.000 | 0.856 | 0.000 | ||
| 2 spectra, ADLSAMSPER | 0.000 | 0.095 | 0.000 | 0.000 | 0.000 | 0.100 | 0.805 | 0.000 |
| Plot | Mito | Lyso or Perox | ER | Golgi | PM | Cytosol | Nucleus | ||||||
| Expt B |
3 peptides |
3 spectra |
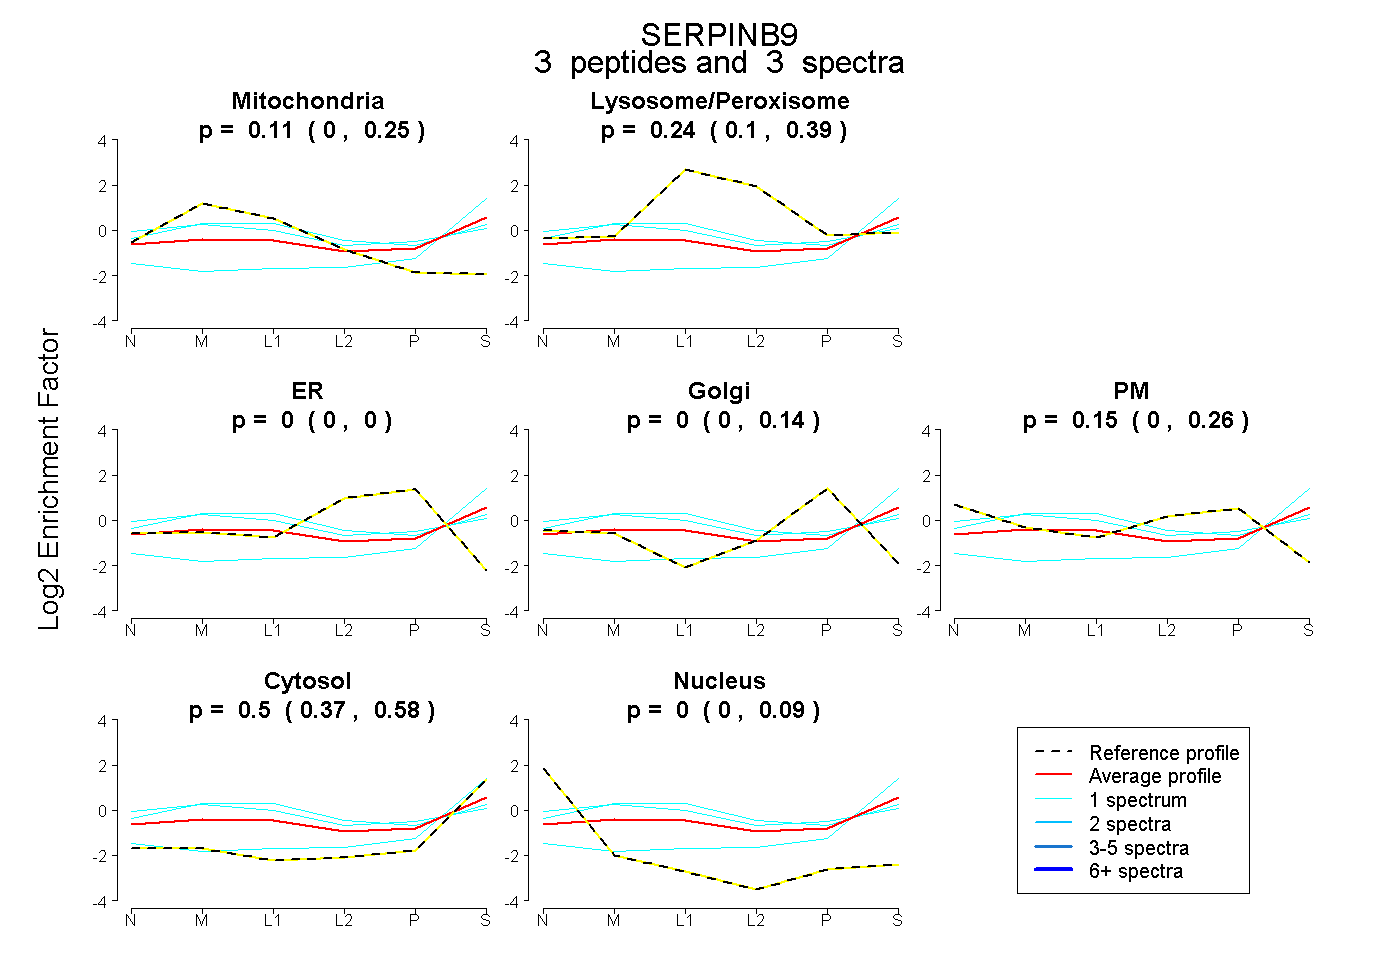 |
0.108 0.000 | 0.255 |
0.239 0.103 | 0.388 |
0.000 0.000 | 0.000 |
0.000 0.000 | 0.138 |
0.150 0.000 | 0.261 |
0.504 0.374 | 0.579 |
0.000 0.000 | 0.090 |
|||
| Plot | Lyso | Other | |||||||||||
| Expt C |
5 peptides |
13 spectra |
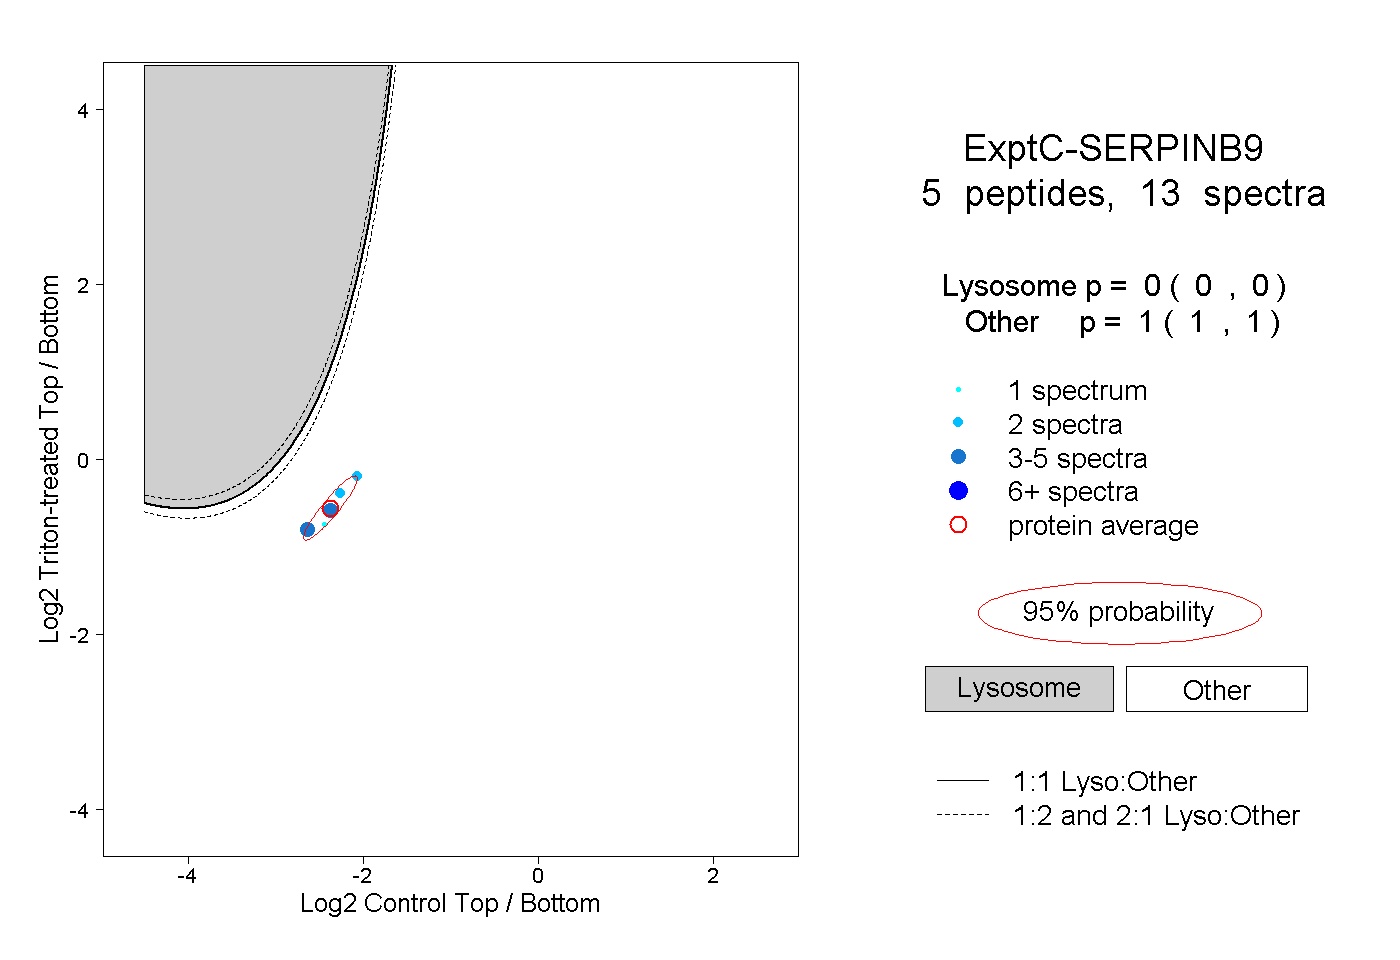 |
0.000 0.000 | 0.000 |
1.000 1.000 | 1.000 |