 8
8peptides
spectra
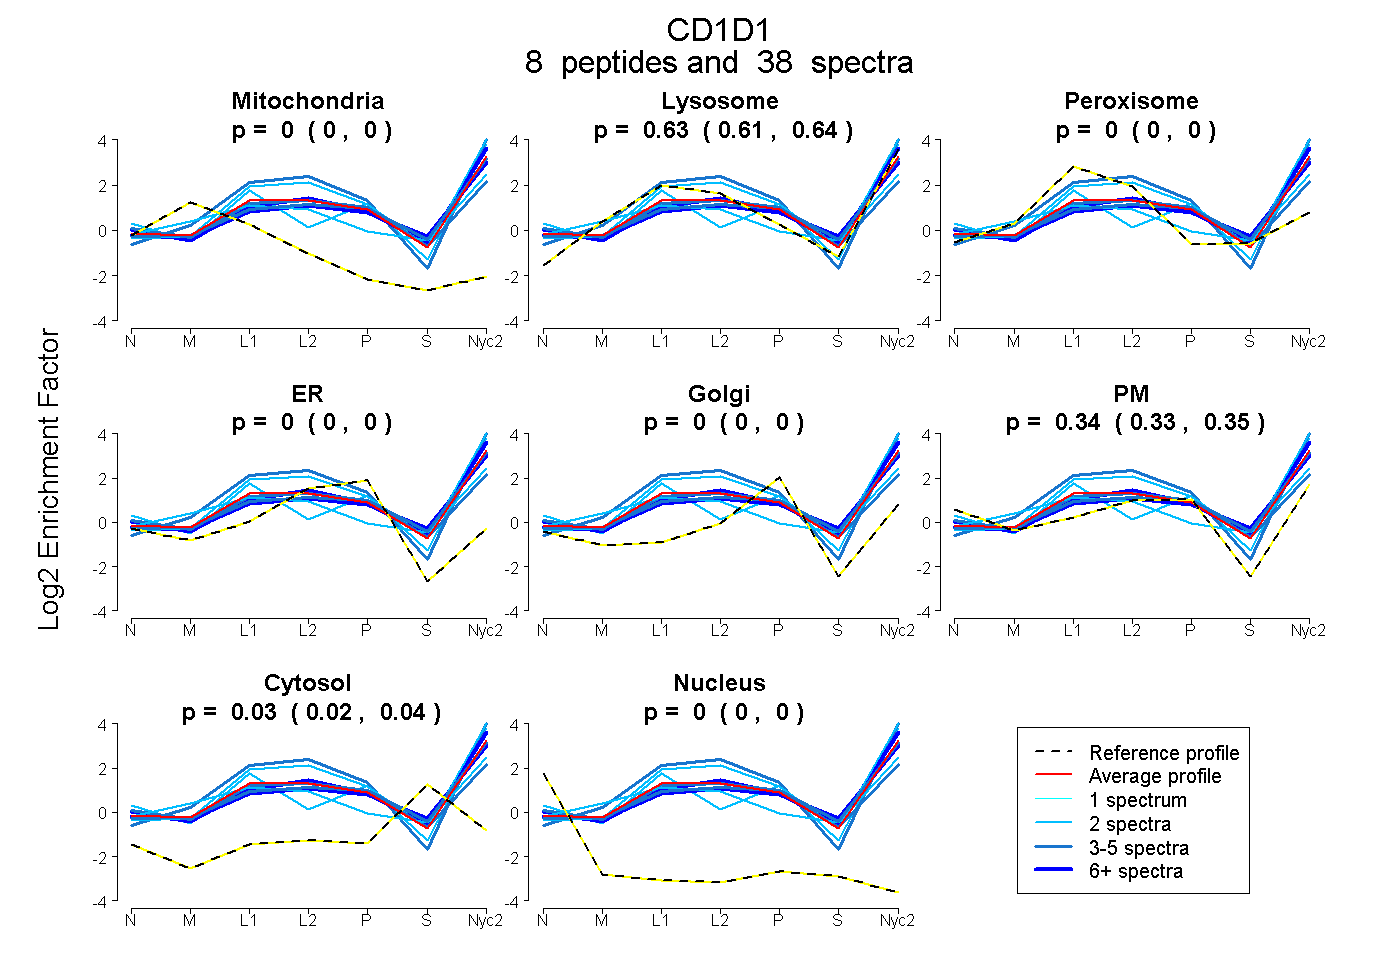
0.000 | 0.000
0.614 | 0.641
0.000 | 0.000
0.000 | 0.000
0.000 | 0.000
0.328 | 0.354
0.020 | 0.036
0.000 | 0.000
3peptides
spectra
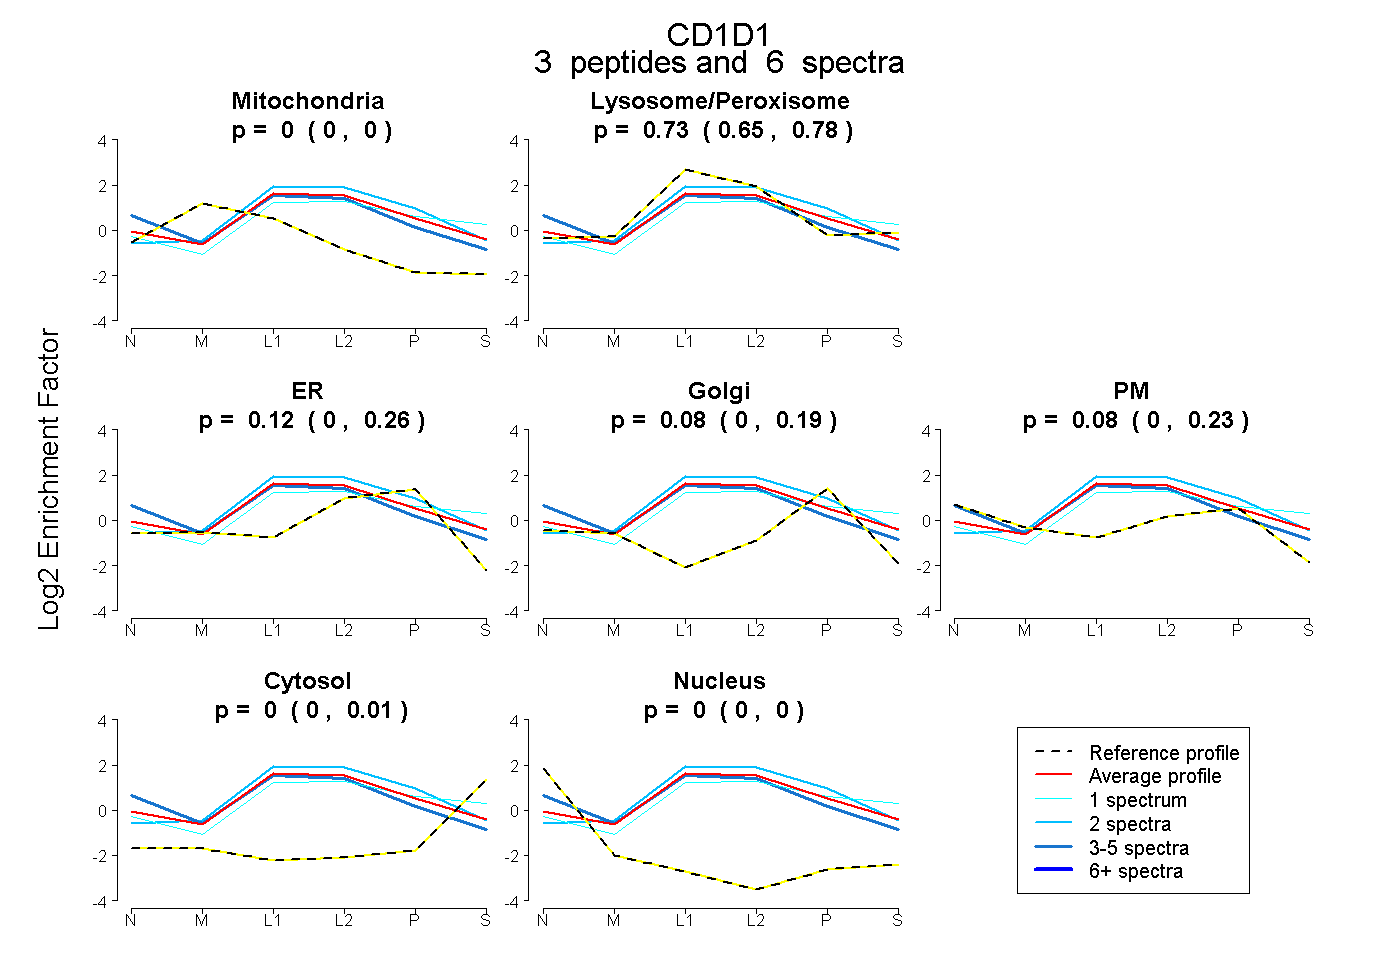
0.000 | 0.000
0.650 | 0.781
0.000 | 0.260
0.000 | 0.193
0.000 | 0.232
0.000 | 0.014
0.000 | 0.000
9peptides
spectra
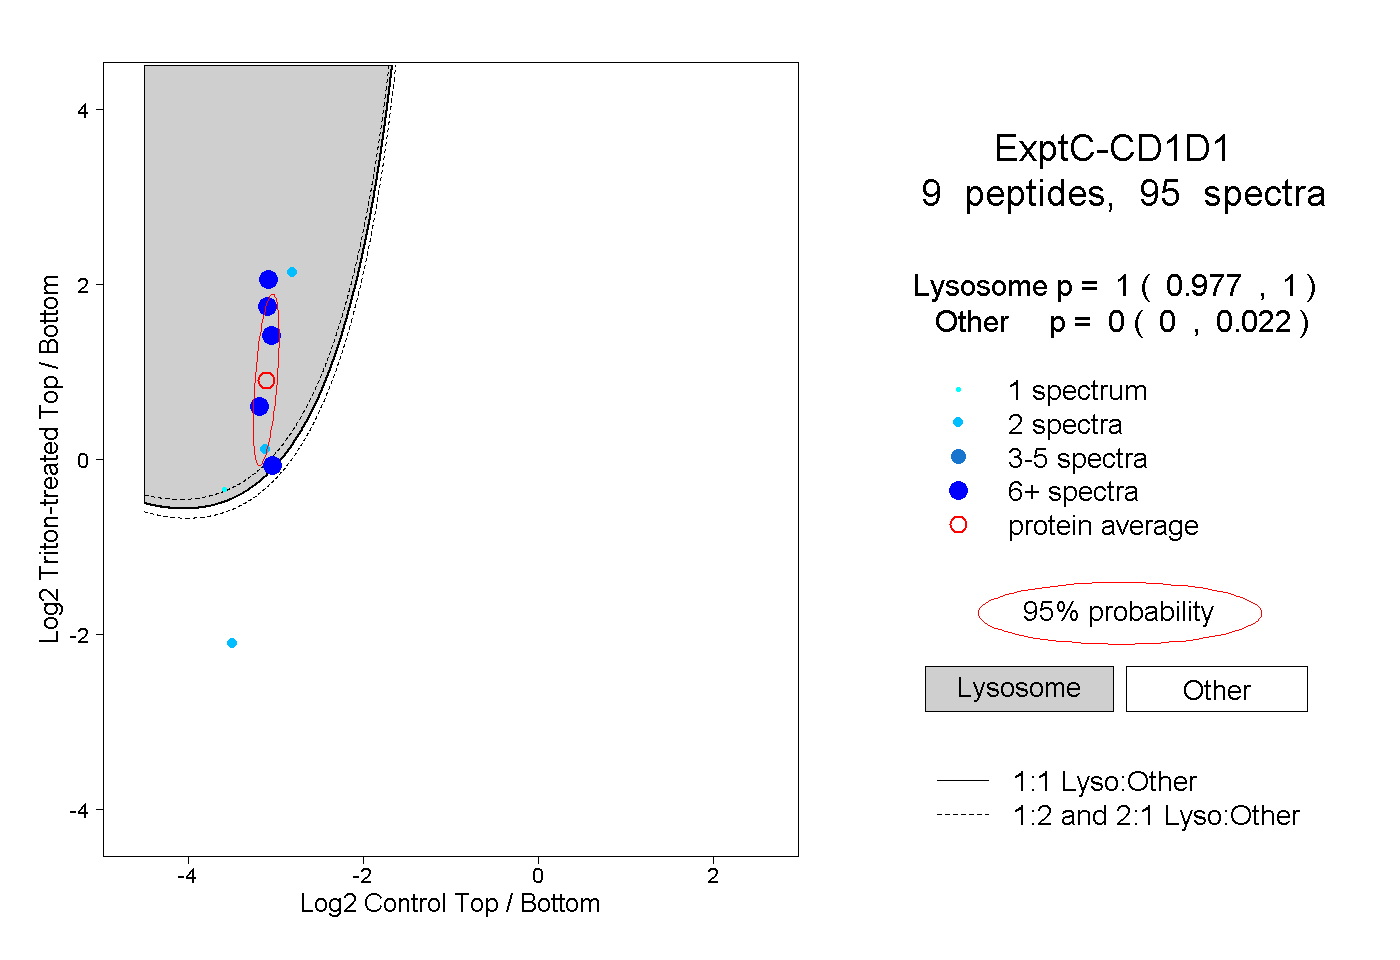
0.977 | 1.000
0.000 | 0.022
2peptides
spectra
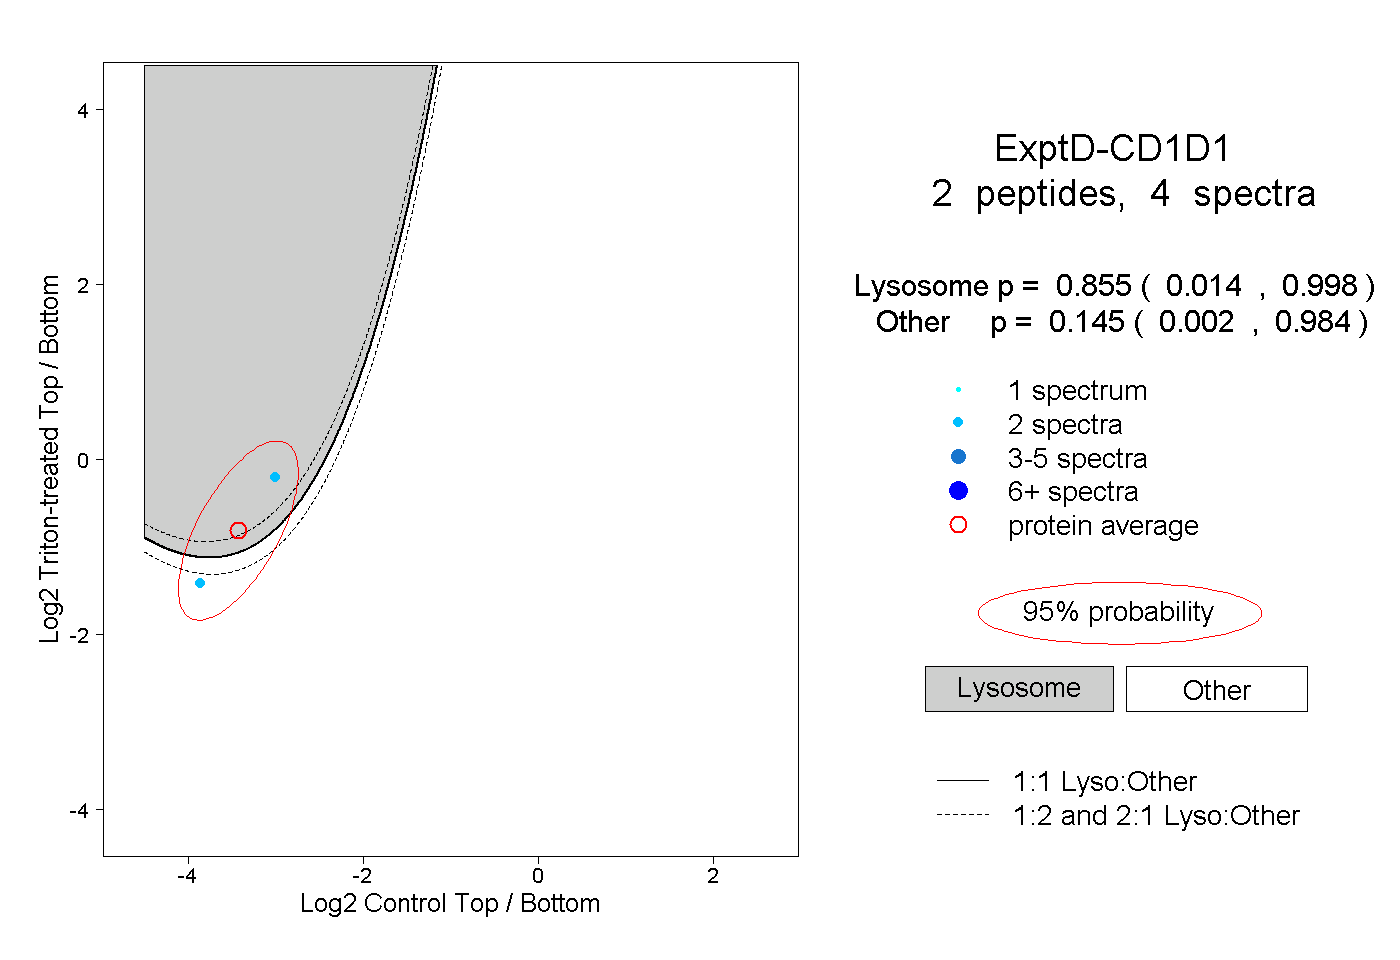
0.014 | 0.998
0.002 | 0.984