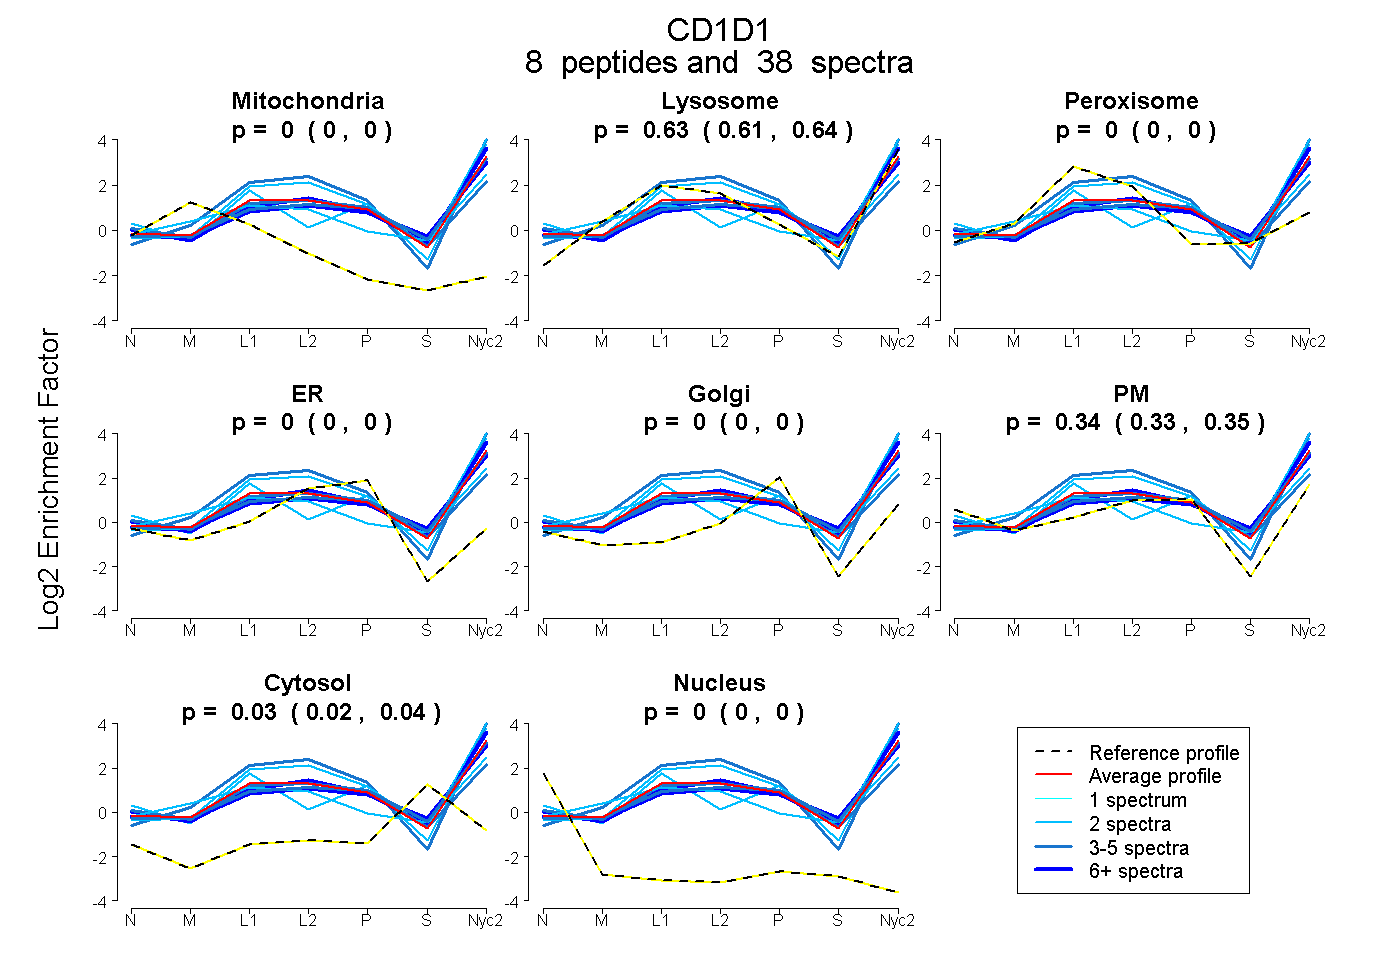
 8
8peptides
spectra
0.000 | 0.000
0.614 | 0.641
0.000 | 0.000
0.000 | 0.000
0.000 | 0.000
0.328 | 0.354
0.020 | 0.036
0.000 | 0.000
| Plot | Mito | Lyso | Perox | ER | Golgi | PM | Cytosol | Nucleus | |||||
| Expt A |
8 peptides |
38 spectra |
|
0.000 0.000 | 0.000 |
0.629 0.614 | 0.641 |
0.000 0.000 | 0.000 |
0.000 0.000 | 0.000 |
0.000 0.000 | 0.000 |
0.343 0.328 | 0.354 |
0.029 0.020 | 0.036 |
0.000 0.000 | 0.000 |
| 2 spectra, TDSVVWLGDLQTHR | 0.000 | 0.486 | 0.161 | 0.000 | 0.000 | 0.227 | 0.126 | 0.000 | ||
| 14 spectra, LQHMFQVYR | 0.000 | 0.578 | 0.000 | 0.000 | 0.000 | 0.296 | 0.126 | 0.000 | ||
| 3 spectra, VPEAPSWLDLPIK | 0.000 | 0.611 | 0.000 | 0.000 | 0.000 | 0.300 | 0.089 | 0.000 | ||
| 2 spectra, QEKPVAWLSR | 0.000 | 0.855 | 0.000 | 0.000 | 0.000 | 0.145 | 0.000 | 0.000 | ||
| 4 spectra, SYQDIM | 0.000 | 0.310 | 0.170 | 0.000 | 0.000 | 0.456 | 0.064 | 0.000 | ||
| 2 spectra, FHGTSWQK | 0.000 | 0.553 | 0.000 | 0.000 | 0.000 | 0.447 | 0.000 | 0.000 | ||
| 3 spectra, FSNQQWEK | 0.000 | 0.850 | 0.000 | 0.000 | 0.000 | 0.150 | 0.000 | 0.000 | ||
| 8 spectra, MLNADEGTR | 0.000 | 0.623 | 0.000 | 0.000 | 0.000 | 0.347 | 0.031 | 0.000 |
| Plot | Mito | Lyso or Perox | ER | Golgi | PM | Cytosol | Nucleus | ||||||
| Expt B |
3 peptides |
6 spectra |
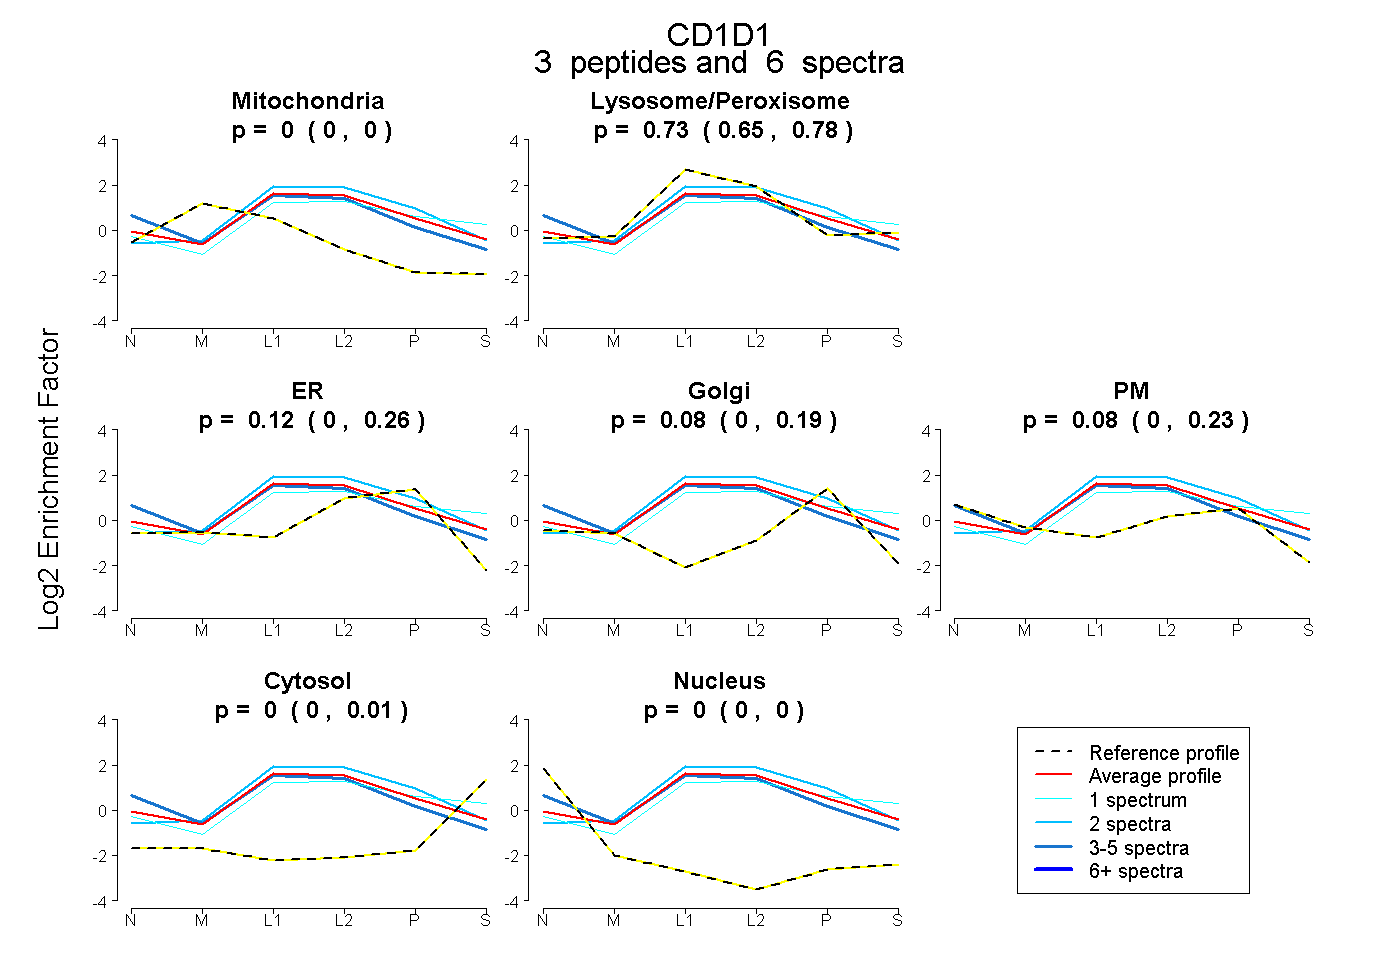 |
0.000 0.000 | 0.000 |
0.725 0.650 | 0.781 |
0.115 0.000 | 0.260 |
0.084 0.000 | 0.193 |
0.076 0.000 | 0.232 |
0.000 0.000 | 0.014 |
0.000 0.000 | 0.000 |
|||
| Plot | Lyso | Other | |||||||||||
| Expt C |
9 peptides |
95 spectra |
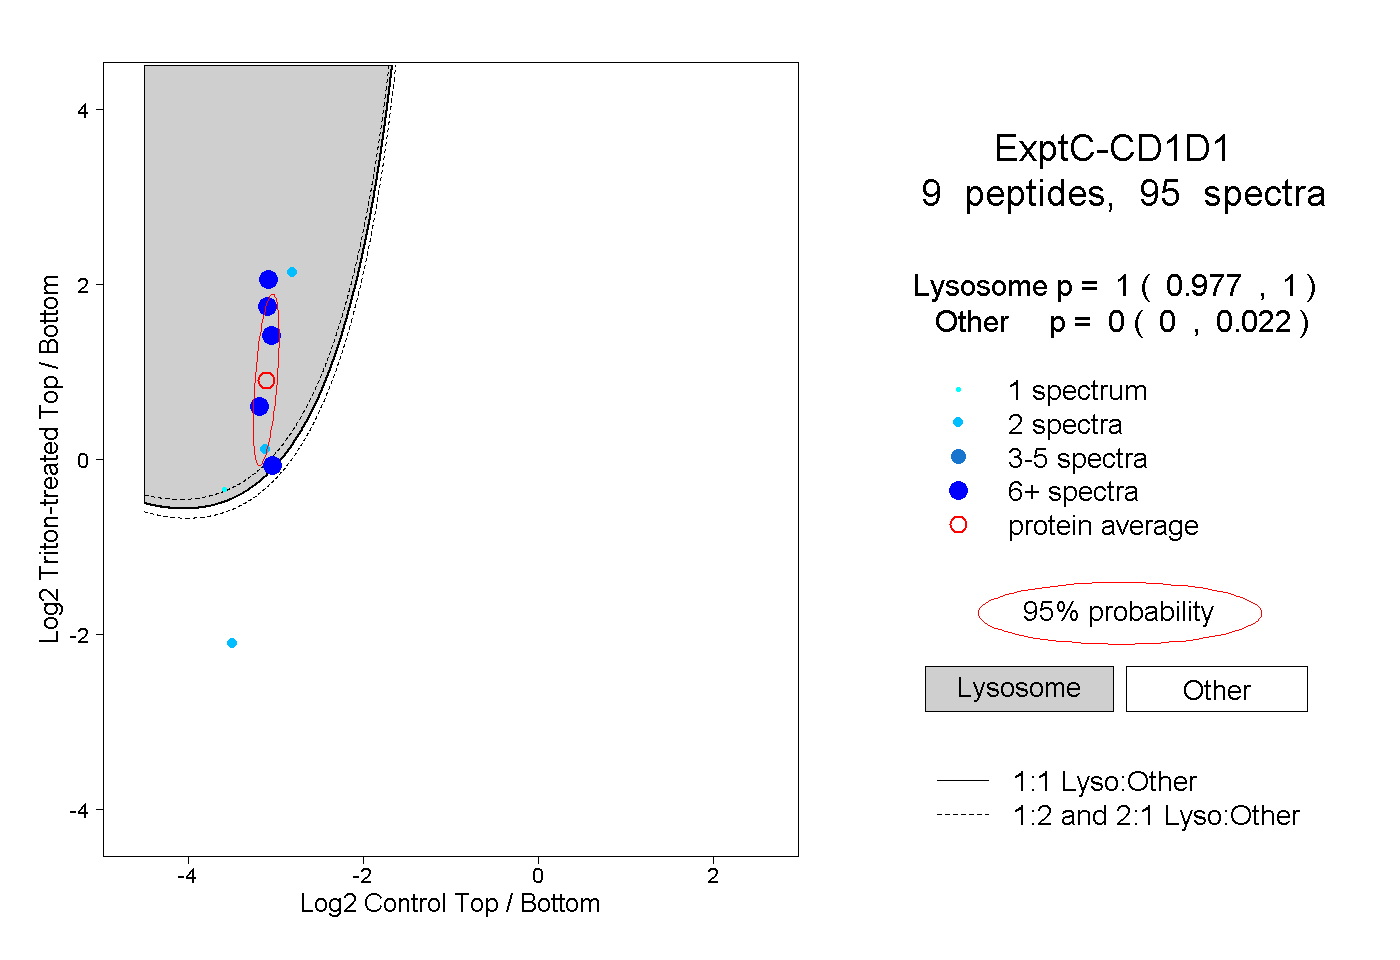 |
1.000 0.977 | 1.000 |
0.000 0.000 | 0.022 |
||||||||
| Plot | Lyso | Other | |||||||||||
| Expt D |
2 peptides |
4 spectra |
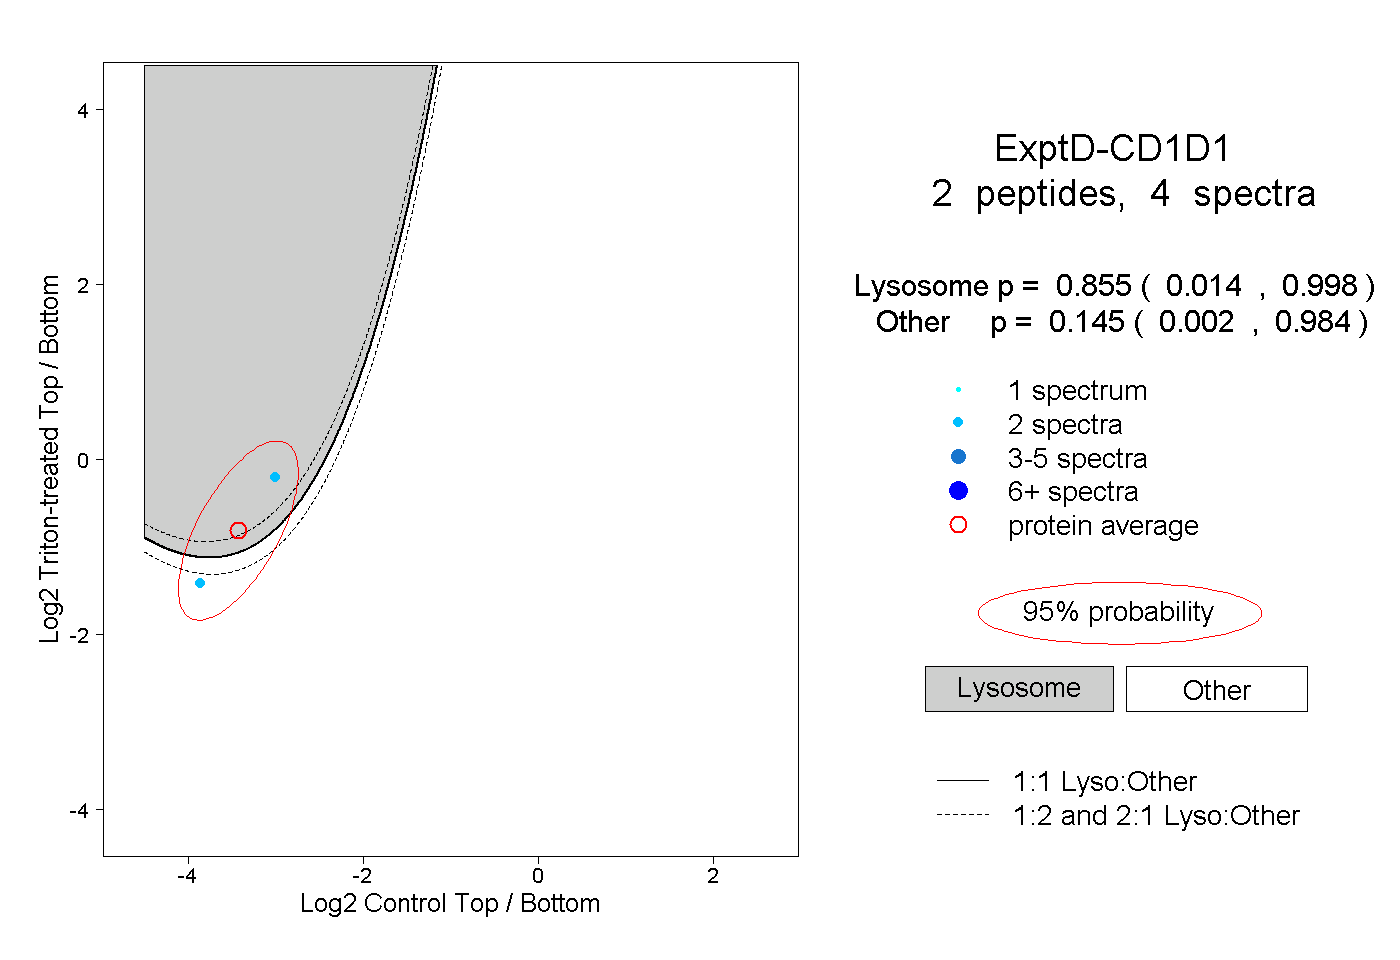 |
0.855 0.014 | 0.998 |
0.145 0.002 | 0.984 |