 7
7peptides
spectra
0.000 | 0.000
0.000 | 0.000
0.000 | 0.000
0.031 | 0.079
0.756 | 0.816
0.000 | 0.000
0.090 | 0.157
0.010 | 0.043
4peptides
spectra
0.000 | 0.000
1.000 | 1.000
| Plot | Mito | Lyso | Perox | ER | Golgi | PM | Cytosol | Nucleus | |||||
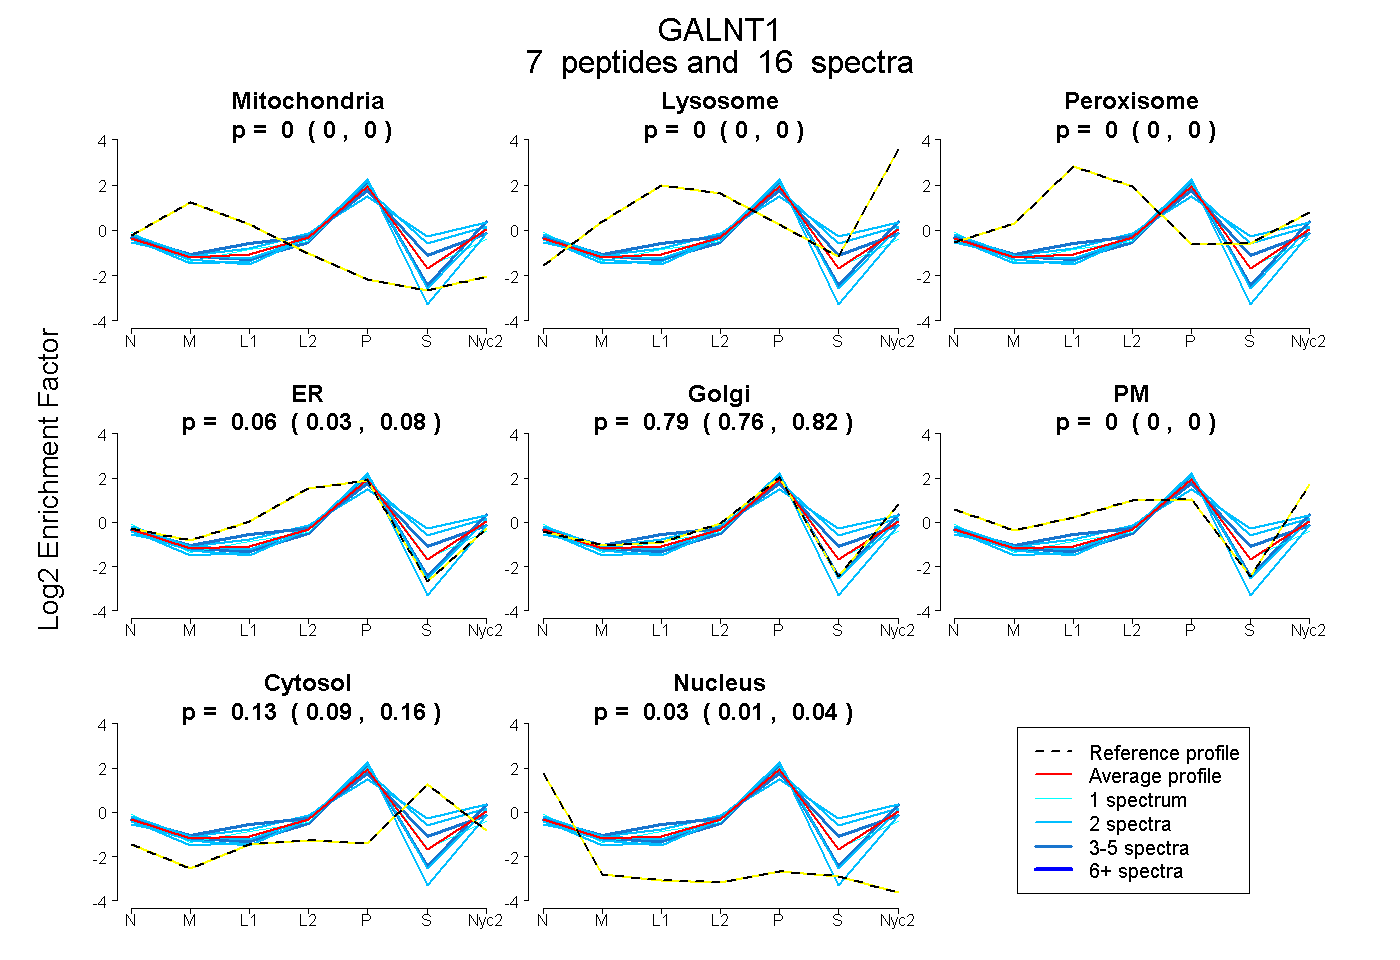
| Expt A |
7 peptides |
16 spectra |
|
0.000 0.000 | 0.000 |
0.000 0.000 | 0.000 |
0.000 0.000 | 0.000 |
0.058 0.031 | 0.079 |
0.787 0.756 | 0.816 |
0.000 0.000 | 0.000 |
0.127 0.090 | 0.157 |
0.028 0.010 | 0.043 |
||
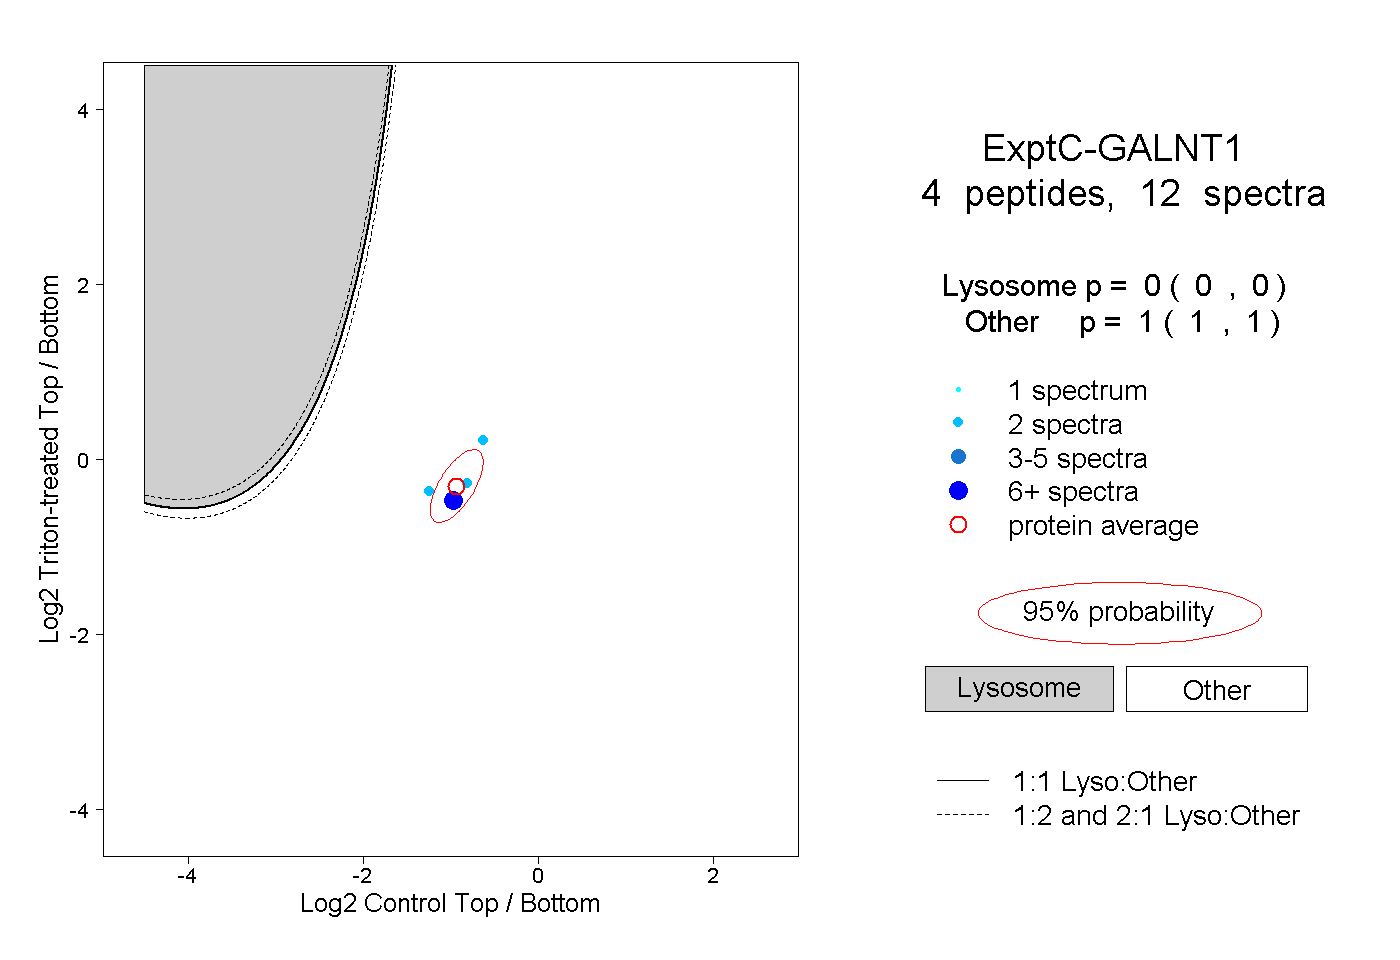
| Plot | Lyso | Other | |||||||||||
| Expt C |
4 peptides |
12 spectra |
|
0.000 0.000 | 0.000 |
1.000 1.000 | 1.000 |