 7
7peptides
spectra
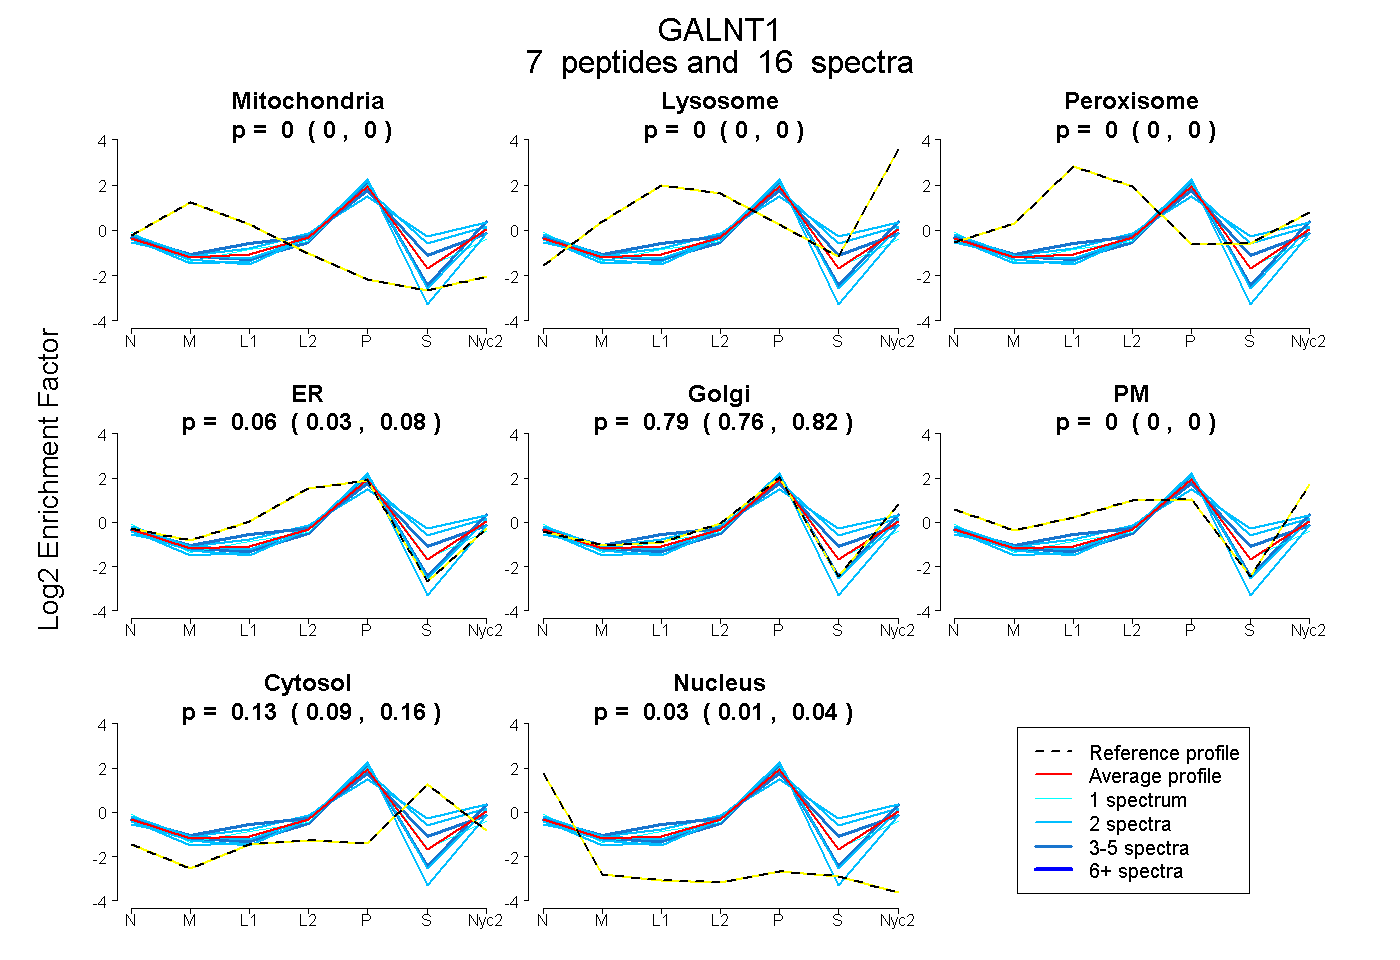
0.000 | 0.000
0.000 | 0.000
0.000 | 0.000
0.031 | 0.079
0.756 | 0.816
0.000 | 0.000
0.090 | 0.157
0.010 | 0.043
| Plot | Mito | Lyso | Perox | ER | Golgi | PM | Cytosol | Nucleus | |||||
| Expt A |
7 peptides |
16 spectra |
|
0.000 0.000 | 0.000 |
0.000 0.000 | 0.000 |
0.000 0.000 | 0.000 |
0.058 0.031 | 0.079 |
0.787 0.756 | 0.816 |
0.000 0.000 | 0.000 |
0.127 0.090 | 0.157 |
0.028 0.010 | 0.043 |
| 2 spectra, NFFYIISPGVTK | 0.000 | 0.010 | 0.081 | 0.000 | 0.603 | 0.000 | 0.305 | 0.000 | ||
| 2 spectra, VPVHVIR | 0.000 | 0.000 | 0.000 | 0.000 | 0.925 | 0.000 | 0.000 | 0.075 | ||
| 1 spectrum, RPLESYVK | 0.000 | 0.000 | 0.000 | 0.164 | 0.642 | 0.000 | 0.120 | 0.074 | ||
| 3 spectra, LAEVWMDEFK | 0.000 | 0.000 | 0.000 | 0.000 | 0.936 | 0.000 | 0.000 | 0.064 | ||
| 2 spectra, GNQLWEYDPVK | 0.000 | 0.000 | 0.000 | 0.000 | 0.711 | 0.000 | 0.289 | 0.000 | ||
| 4 spectra, TVHSVLNR | 0.000 | 0.000 | 0.006 | 0.226 | 0.533 | 0.000 | 0.235 | 0.000 | ||
| 2 spectra, VDYGDISSR | 0.000 | 0.000 | 0.000 | 0.121 | 0.782 | 0.000 | 0.000 | 0.097 |
| Plot | Lyso | Other | |||||||||||
| Expt C |
4 peptides |
12 spectra |
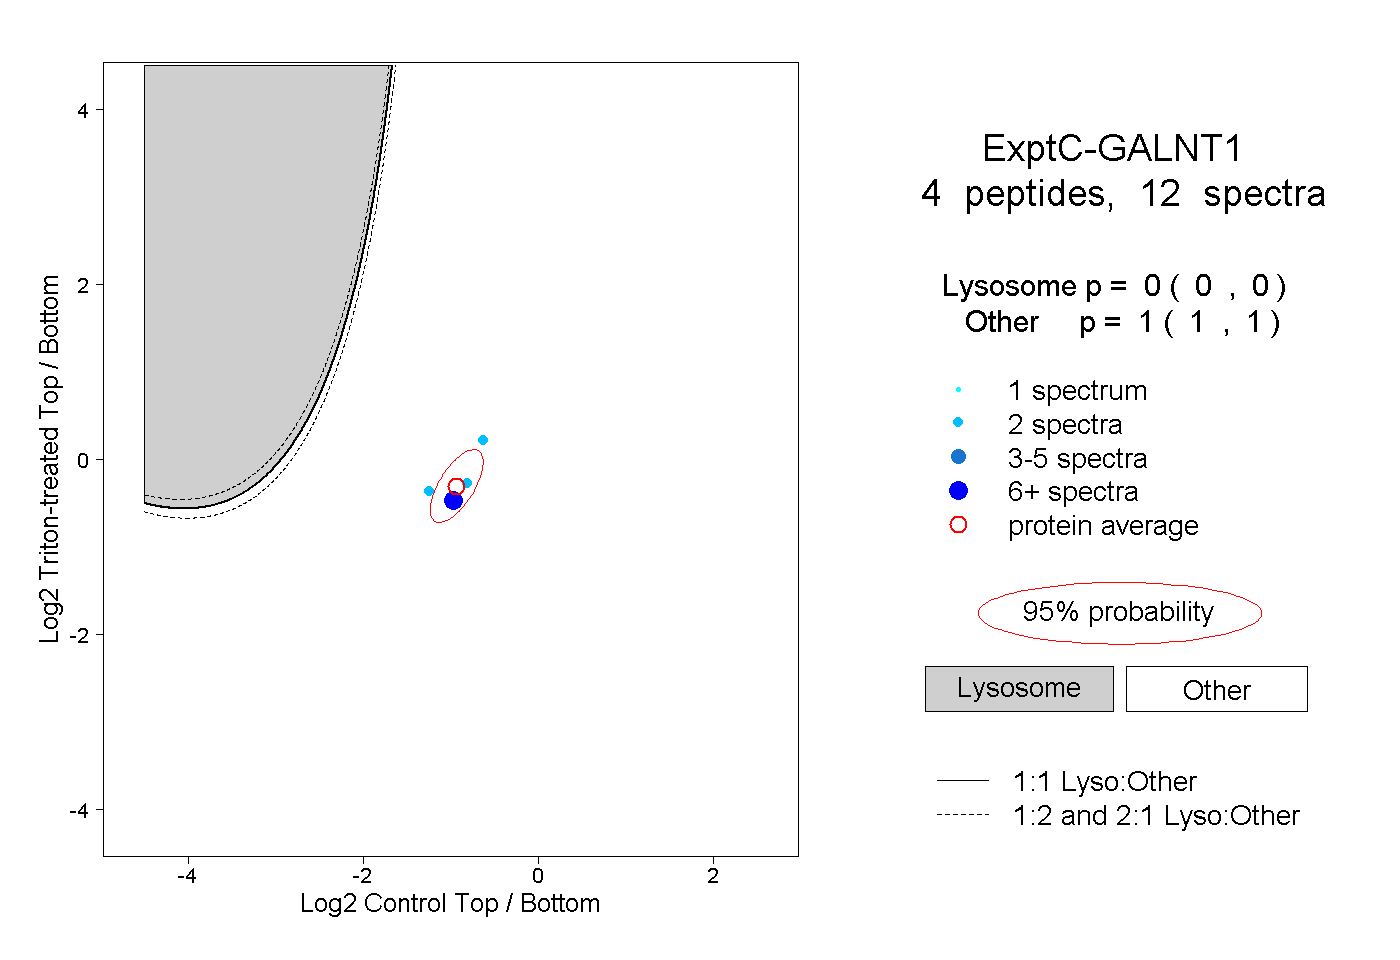 |
0.000 0.000 | 0.000 |
1.000 1.000 | 1.000 |