 3
3peptides
spectra
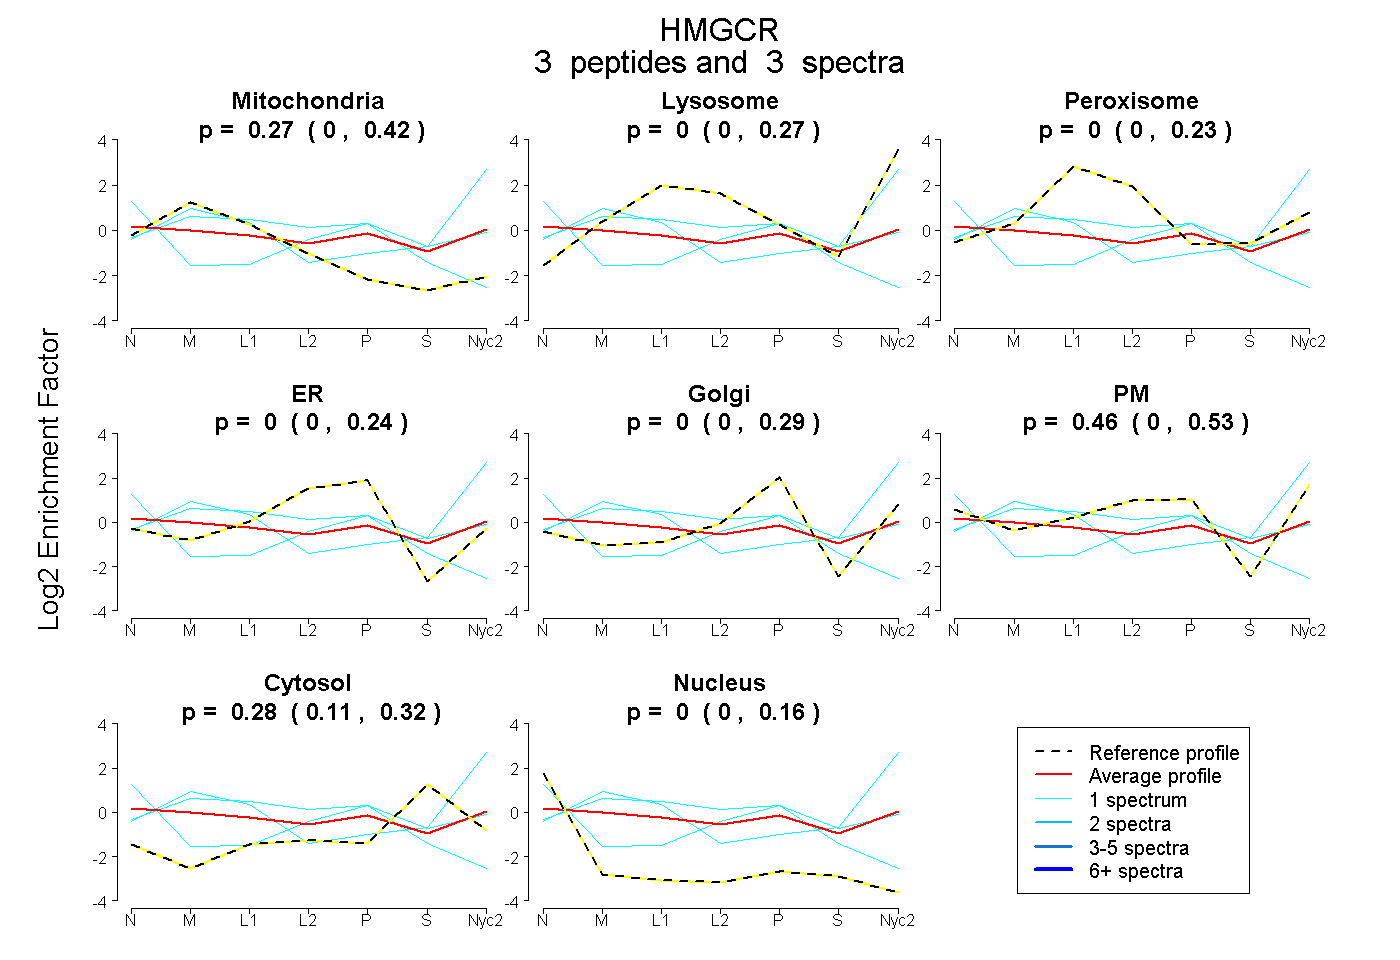
0.000 | 0.421
0.000 | 0.267
0.000 | 0.227
0.000 | 0.242
0.000 | 0.292
0.000 | 0.531
0.107 | 0.323
0.000 | 0.164
3peptides
spectra
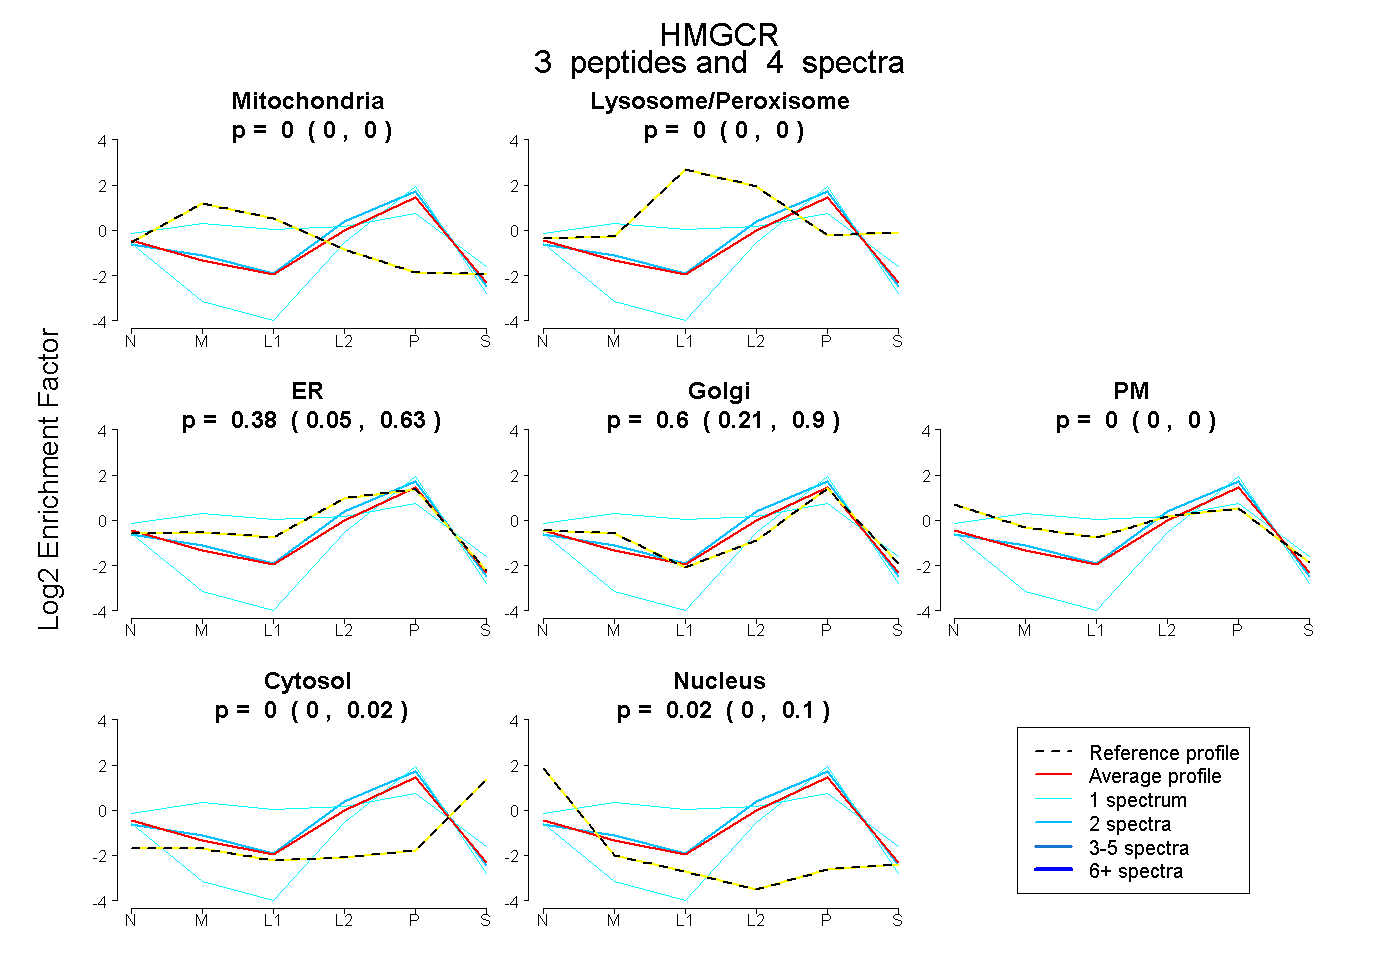
0.000 | 0.000
0.000 | 0.000
0.048 | 0.634
0.210 | 0.900
0.000 | 0.000
0.000 | 0.019
0.000 | 0.097
4peptides
spectra
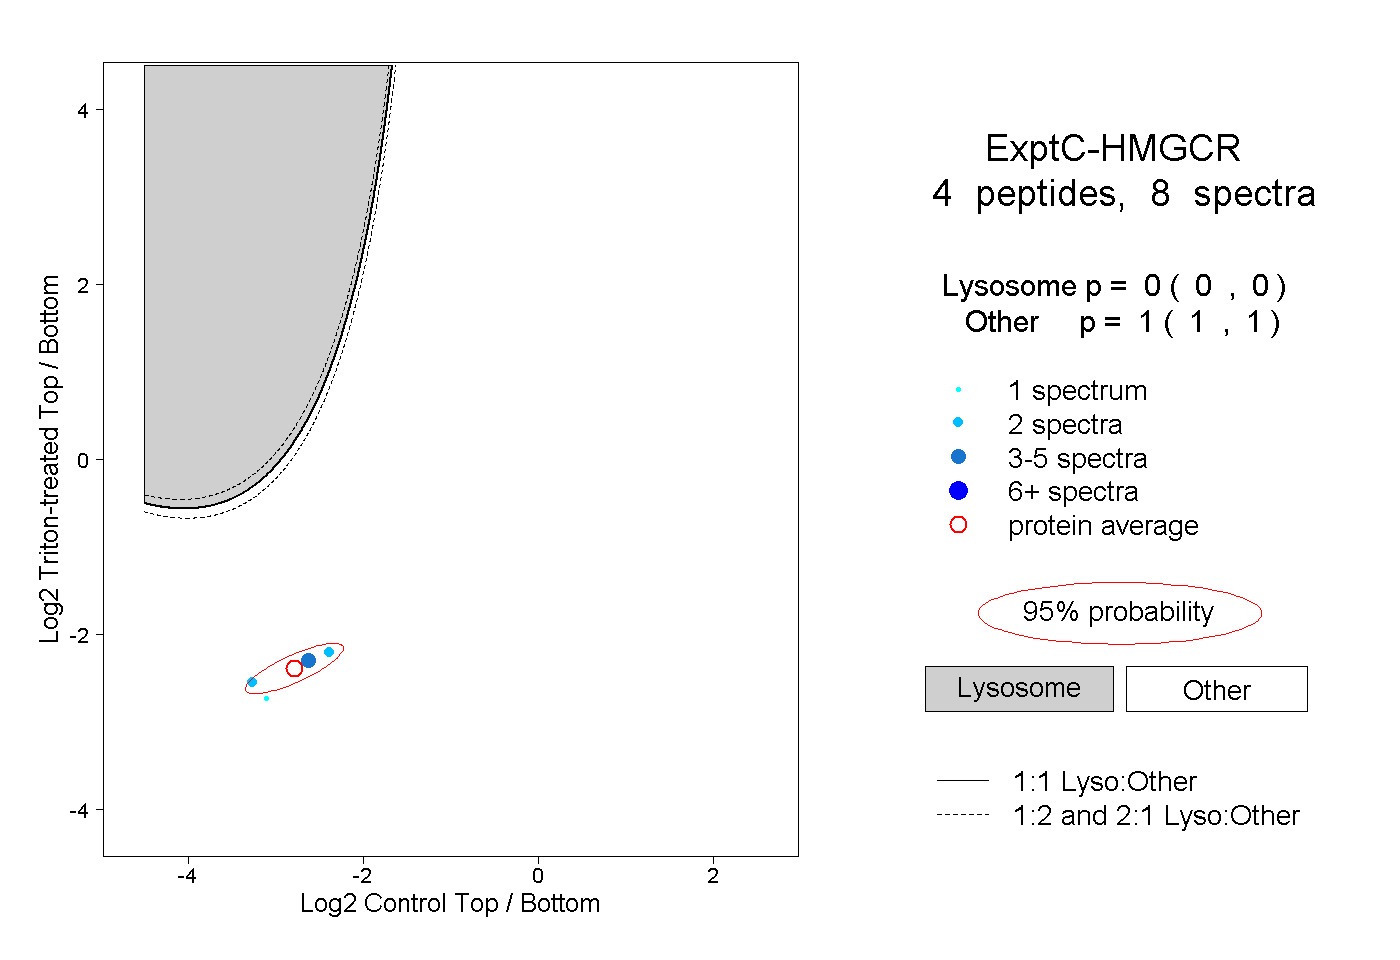
0.000 | 0.000
1.000 | 1.000