 3
3peptides
spectra
0.000 | 0.421
0.000 | 0.267
0.000 | 0.227
0.000 | 0.242
0.000 | 0.292
0.000 | 0.531
0.107 | 0.323
0.000 | 0.164
| Plot | Mito | Lyso | Perox | ER | Golgi | PM | Cytosol | Nucleus | |||||
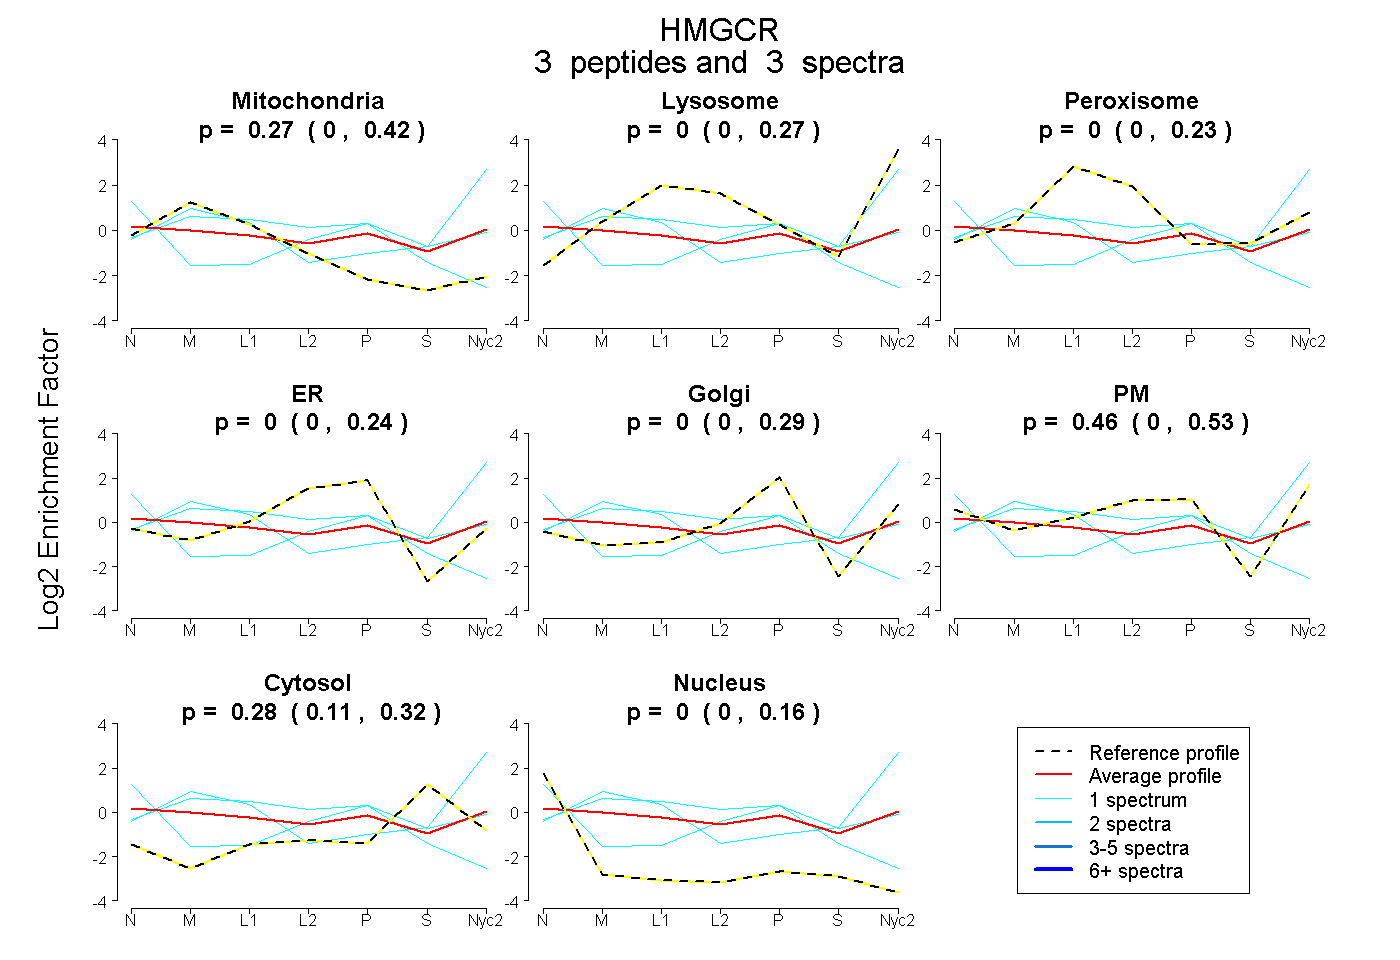
| Expt A |
3 peptides |
3 spectra |
|
0.268 0.000 | 0.421 |
0.000 0.000 | 0.267 |
0.001 0.000 | 0.227 |
0.000 0.000 | 0.242 |
0.000 0.000 | 0.292 |
0.456 0.000 | 0.531 |
0.276 0.107 | 0.323 |
0.000 0.000 | 0.164 |
| 1 spectrum, ASALAK | 0.164 | 0.619 | 0.000 | 0.000 | 0.000 | 0.000 | 0.114 | 0.102 | ||
| 1 spectrum, MIMSLGLVLVHAHSR | 0.217 | 0.000 | 0.365 | 0.000 | 0.318 | 0.000 | 0.100 | 0.000 | ||
| 1 spectrum, LHVTLAGR | 0.000 | 0.000 | 0.000 | 0.481 | 0.000 | 0.000 | 0.111 | 0.408 |
| Plot | Mito | Lyso or Perox | ER | Golgi | PM | Cytosol | Nucleus | ||||||
| Expt B |
3 peptides |
4 spectra |
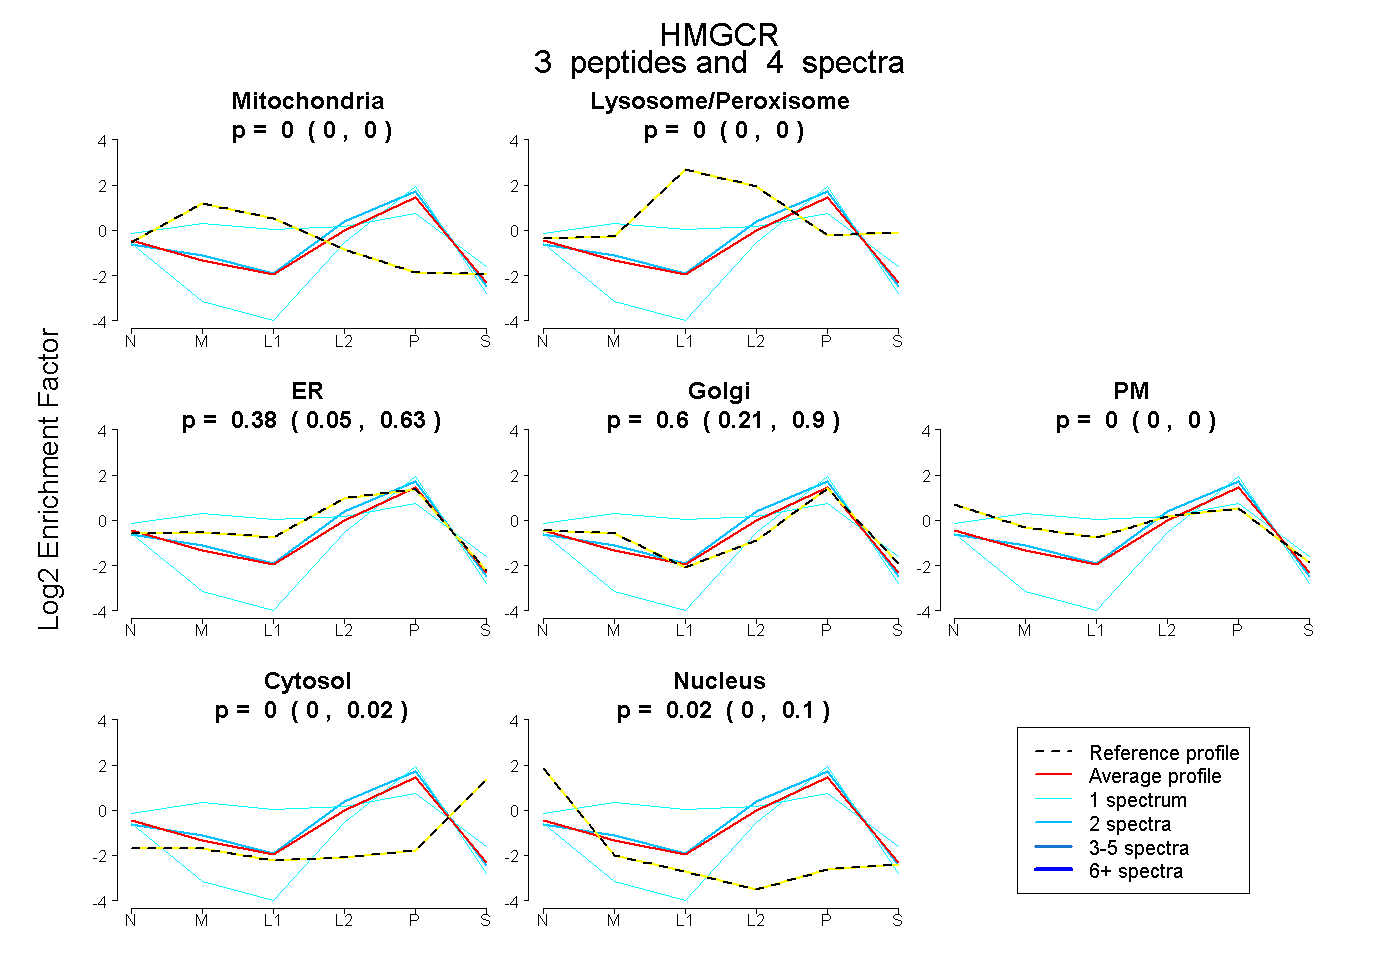 |
0.000 0.000 | 0.000 |
0.000 0.000 | 0.000 |
0.380 0.048 | 0.634 |
0.596 0.210 | 0.900 |
0.000 0.000 | 0.000 |
0.000 0.000 | 0.019 |
0.024 0.000 | 0.097 |
|||
| Plot | Lyso | Other | |||||||||||
| Expt C |
4 peptides |
8 spectra |
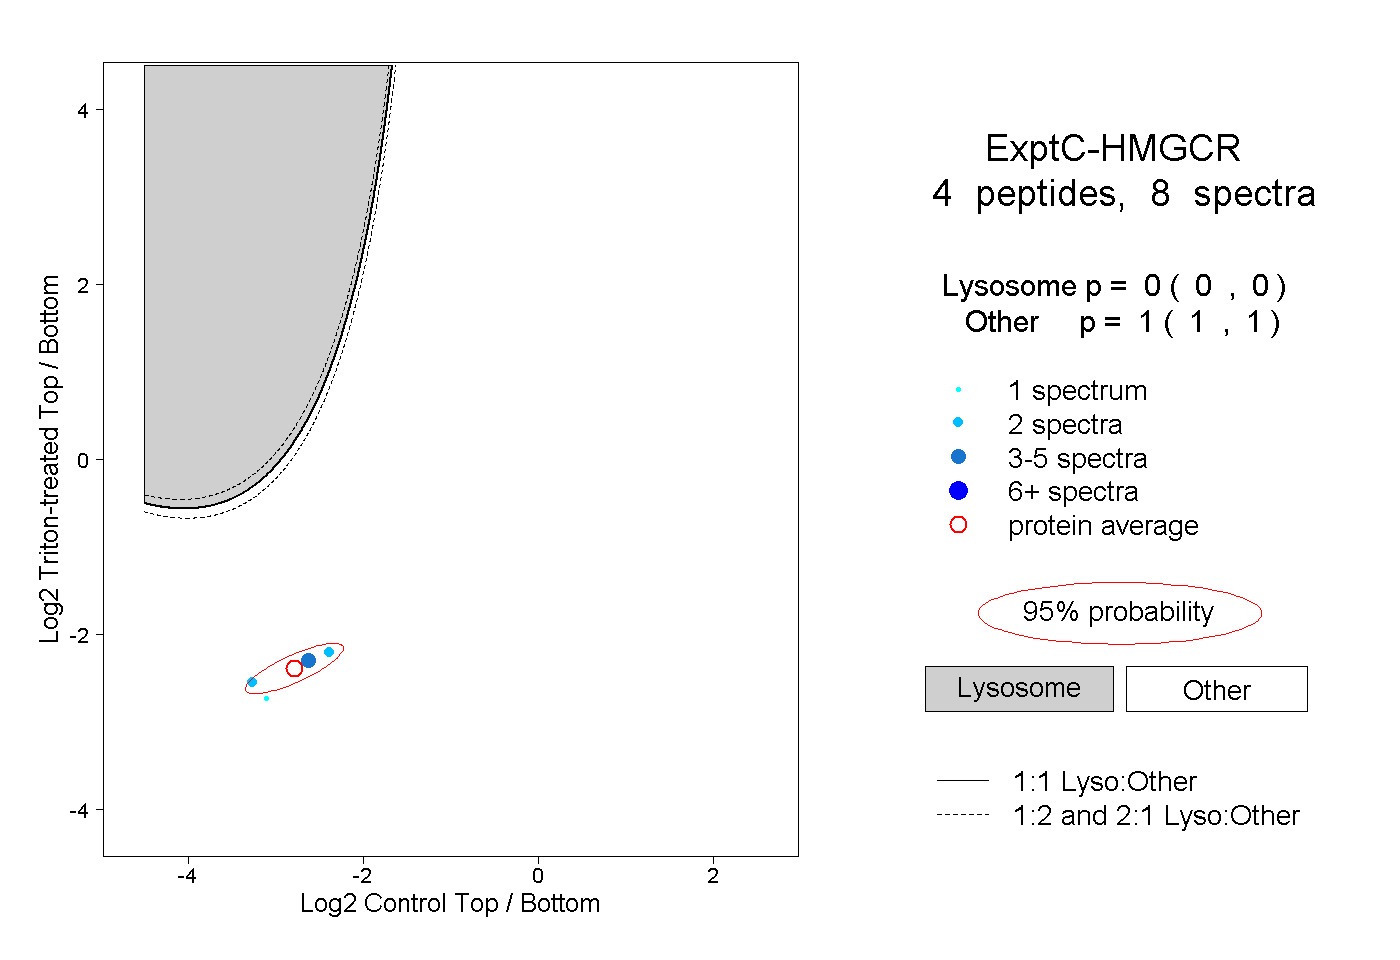 |
0.000 0.000 | 0.000 |
1.000 1.000 | 1.000 |