 4
4peptides
spectra
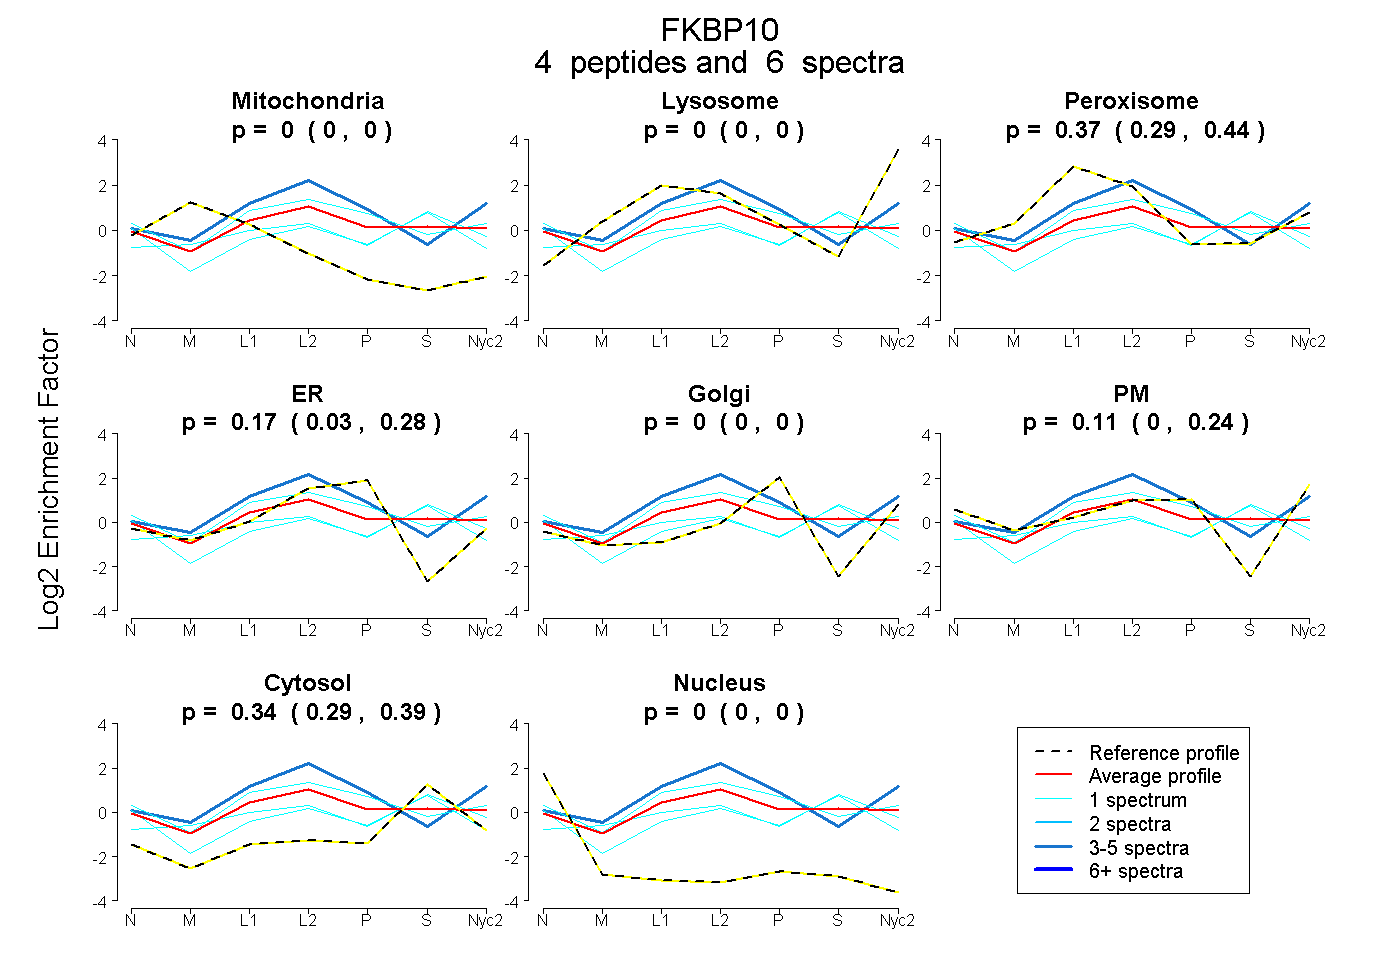
0.000 | 0.000
0.000 | 0.000
0.294 | 0.436
0.033 | 0.283
0.000 | 0.000
0.000 | 0.240
0.288 | 0.386
0.000 | 0.000
6peptides
spectra
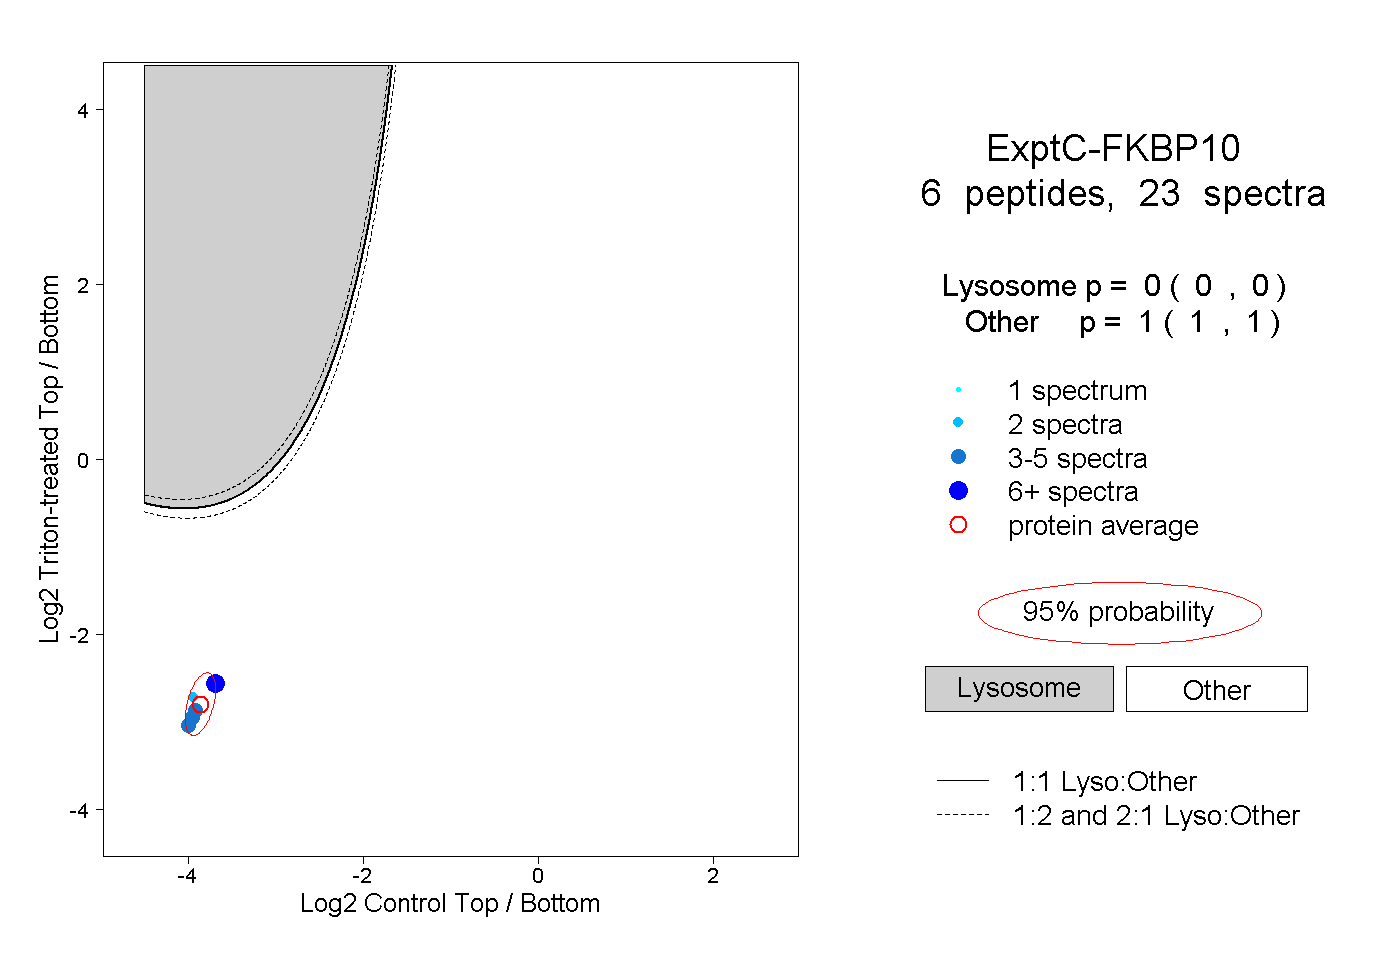
0.000 | 0.000
1.000 | 1.000
1peptide
spectra
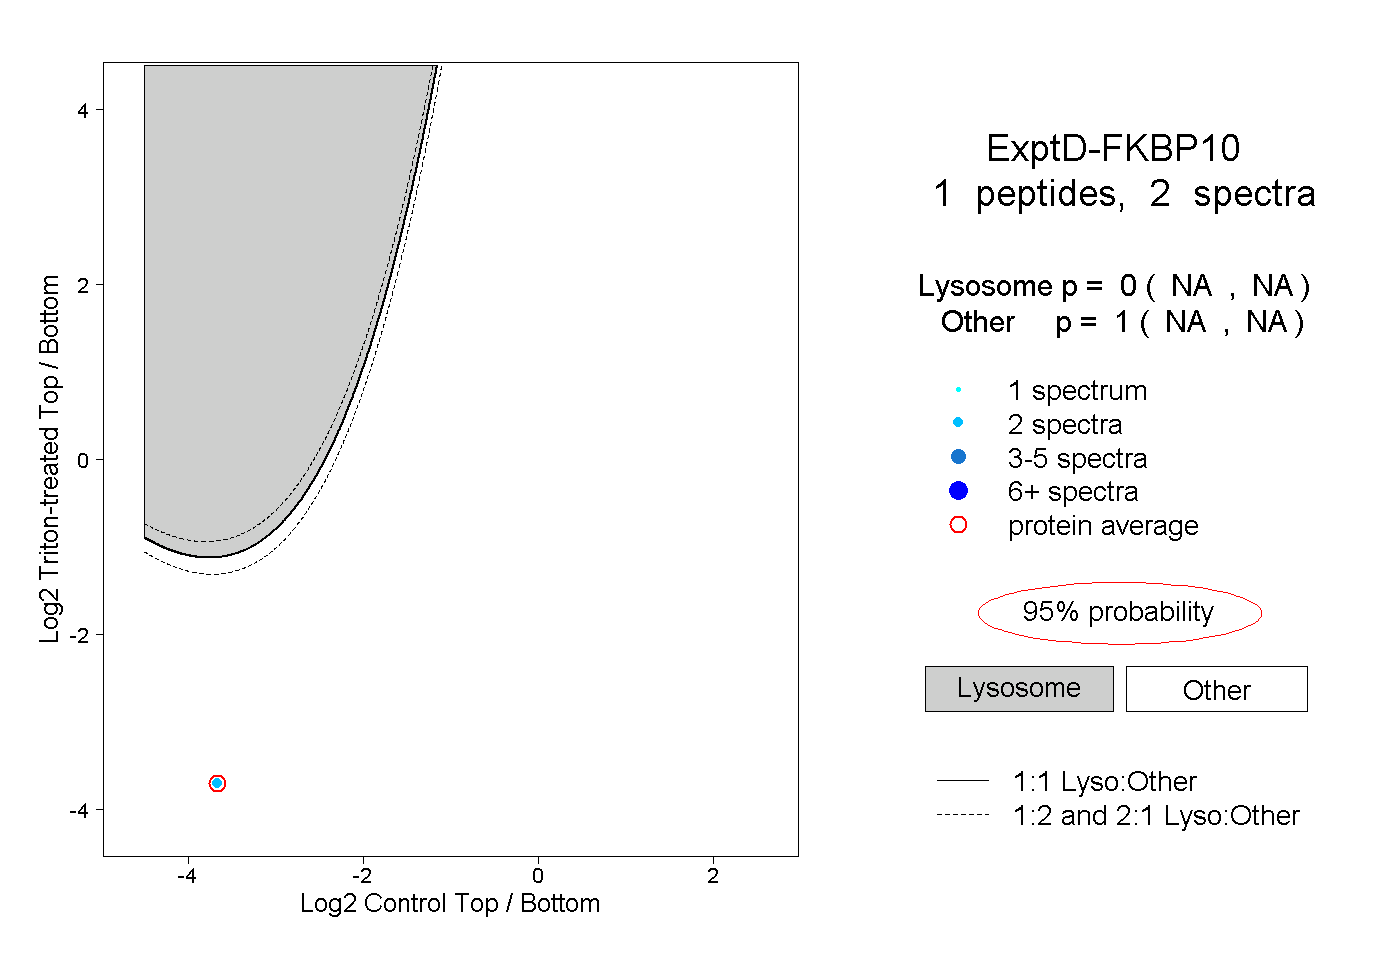
NA | NA
NA | NA