 4
4peptides
spectra
0.000 | 0.000
0.000 | 0.000
0.294 | 0.436
0.033 | 0.283
0.000 | 0.000
0.000 | 0.240
0.288 | 0.386
0.000 | 0.000
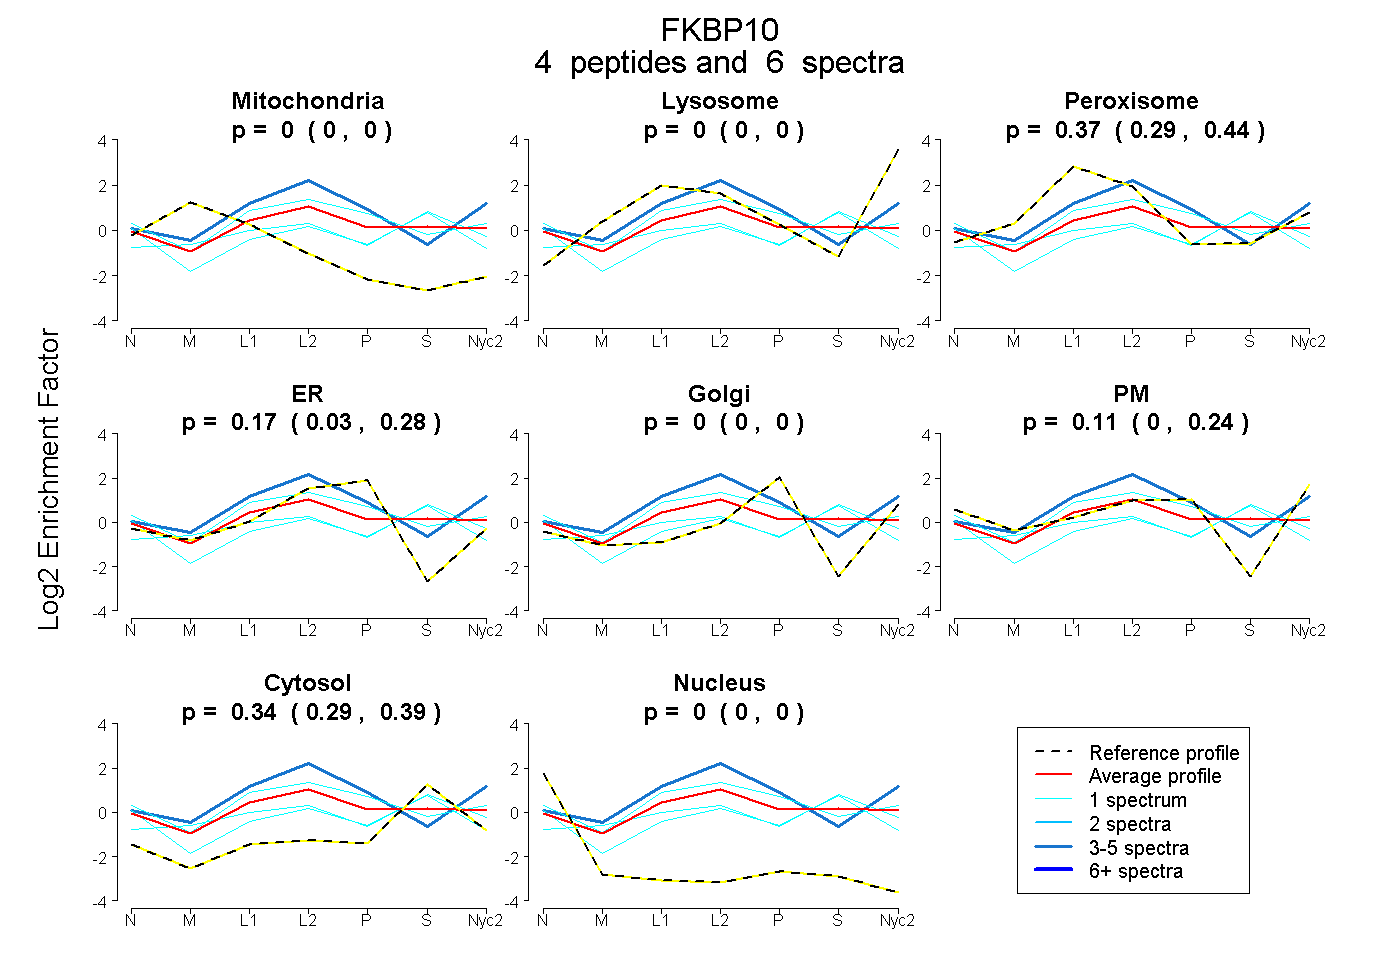
| Plot | Mito | Lyso | Perox | ER | Golgi | PM | Cytosol | Nucleus | |||||
| Expt A |
4 peptides |
6 spectra |
|
0.000 0.000 | 0.000 |
0.000 0.000 | 0.000 |
0.374 0.294 | 0.436 |
0.173 0.033 | 0.283 |
0.000 0.000 | 0.000 |
0.113 0.000 | 0.240 |
0.340 0.288 | 0.386 |
0.000 0.000 | 0.000 |
| 1 spectrum, IIIPPFLAYGEK | 0.000 | 0.000 | 0.387 | 0.262 | 0.000 | 0.149 | 0.202 | 0.000 | ||
| 3 spectra, IGDFIR | 0.000 | 0.111 | 0.411 | 0.244 | 0.000 | 0.206 | 0.027 | 0.000 | ||
| 1 spectrum, ITAEELK | 0.012 | 0.000 | 0.405 | 0.039 | 0.000 | 0.008 | 0.536 | 0.000 | ||
| 1 spectrum, LITGMDR | 0.000 | 0.000 | 0.240 | 0.120 | 0.000 | 0.000 | 0.578 | 0.061 |
| Plot | Lyso | Other | |||||||||||
| Expt C |
6 peptides |
23 spectra |
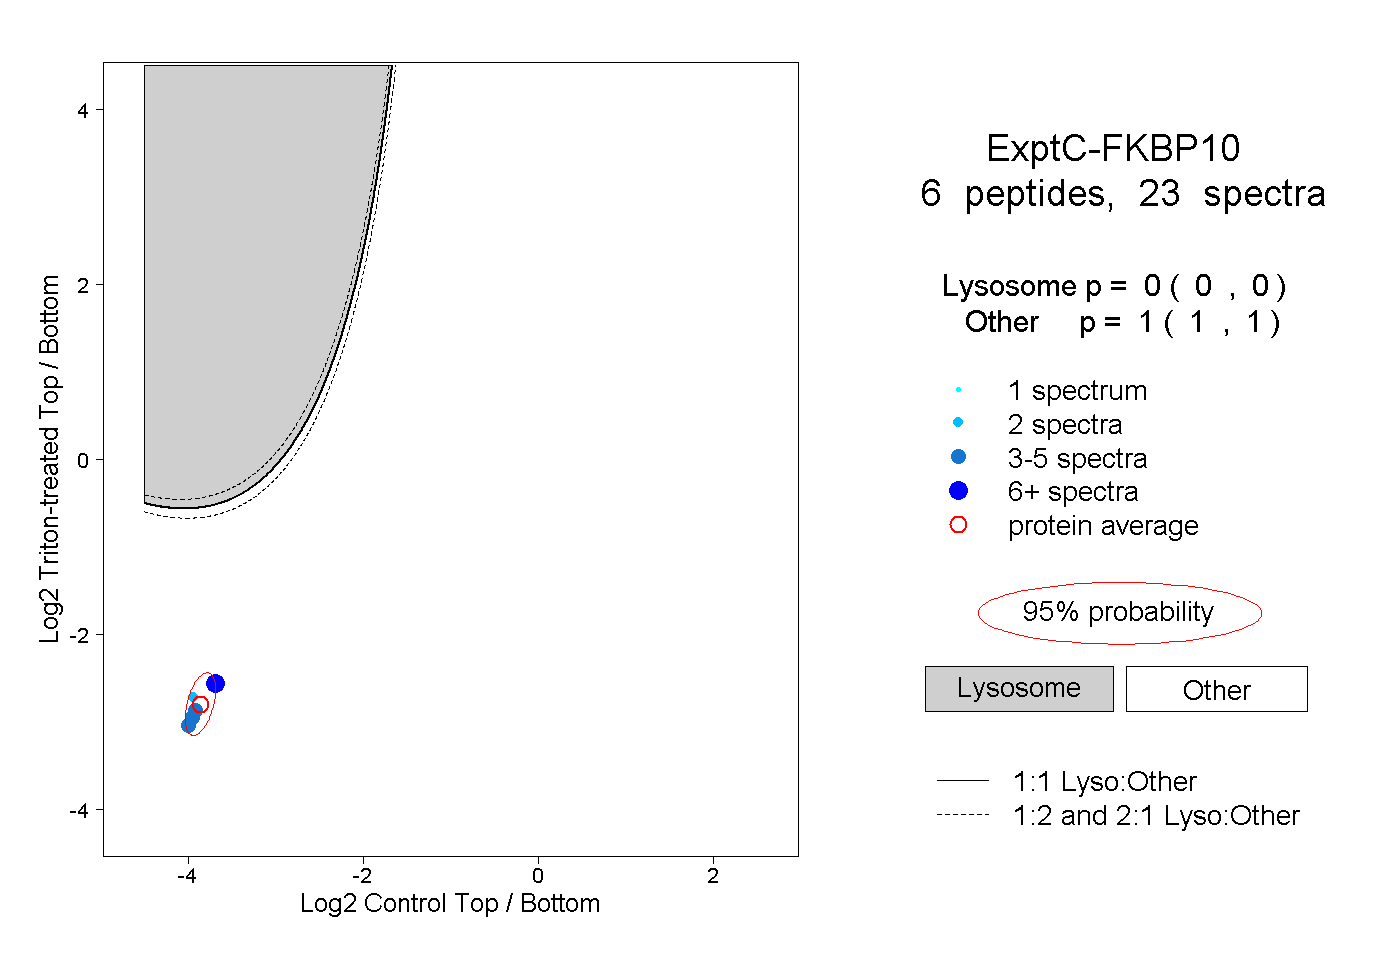 |
0.000 0.000 | 0.000 |
1.000 1.000 | 1.000 |
||||||||
| Plot | Lyso | Other | |||||||||||
| Expt D |
1 peptide |
2 spectra |
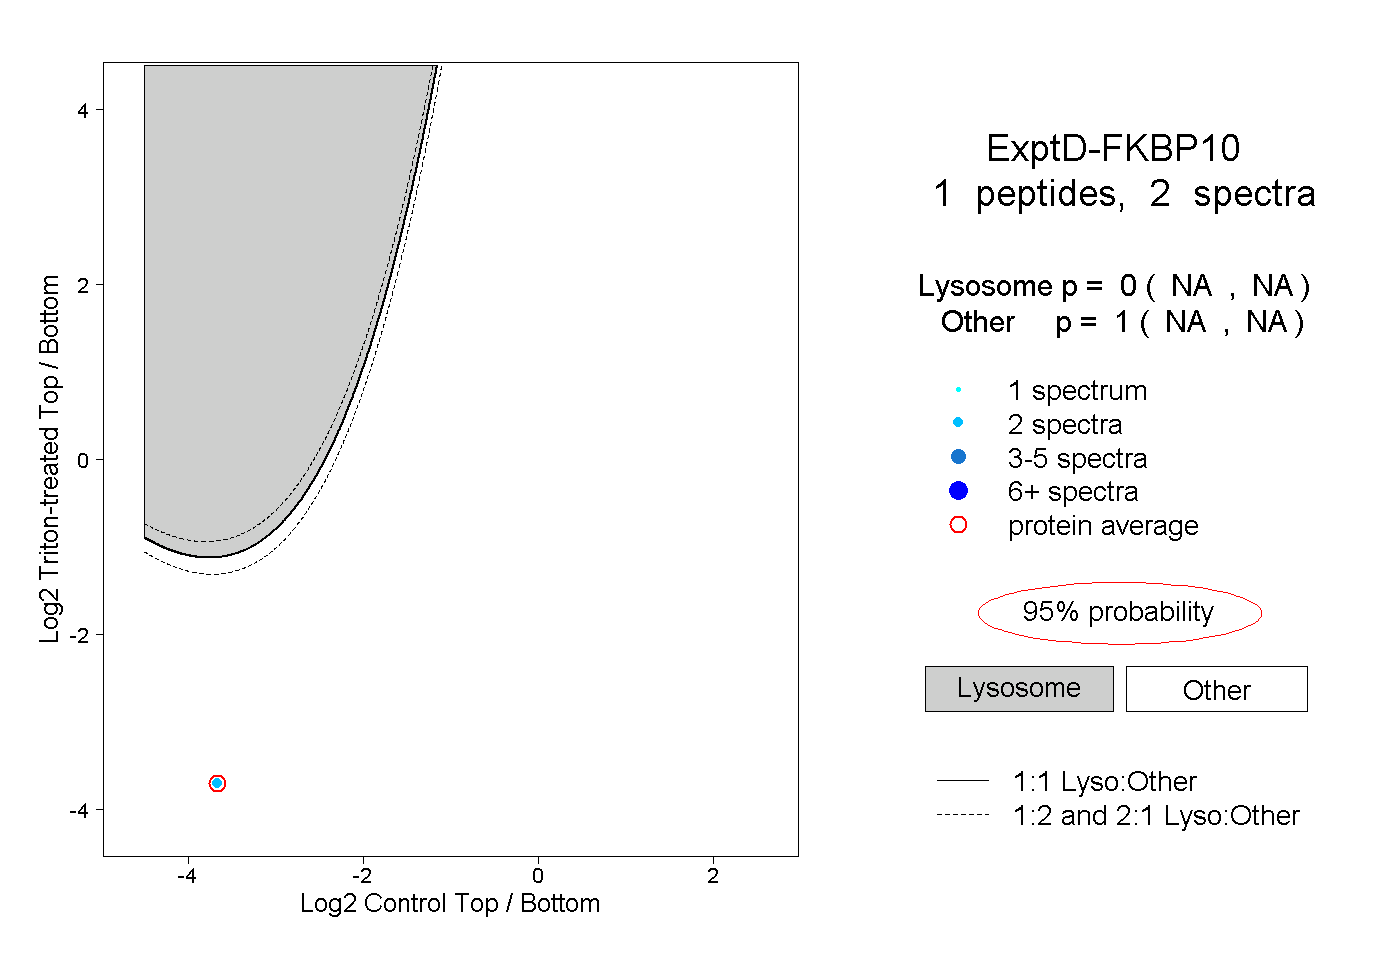 |
0.000 NA | NA |
1.000 NA | NA |