 9
9peptides
spectra
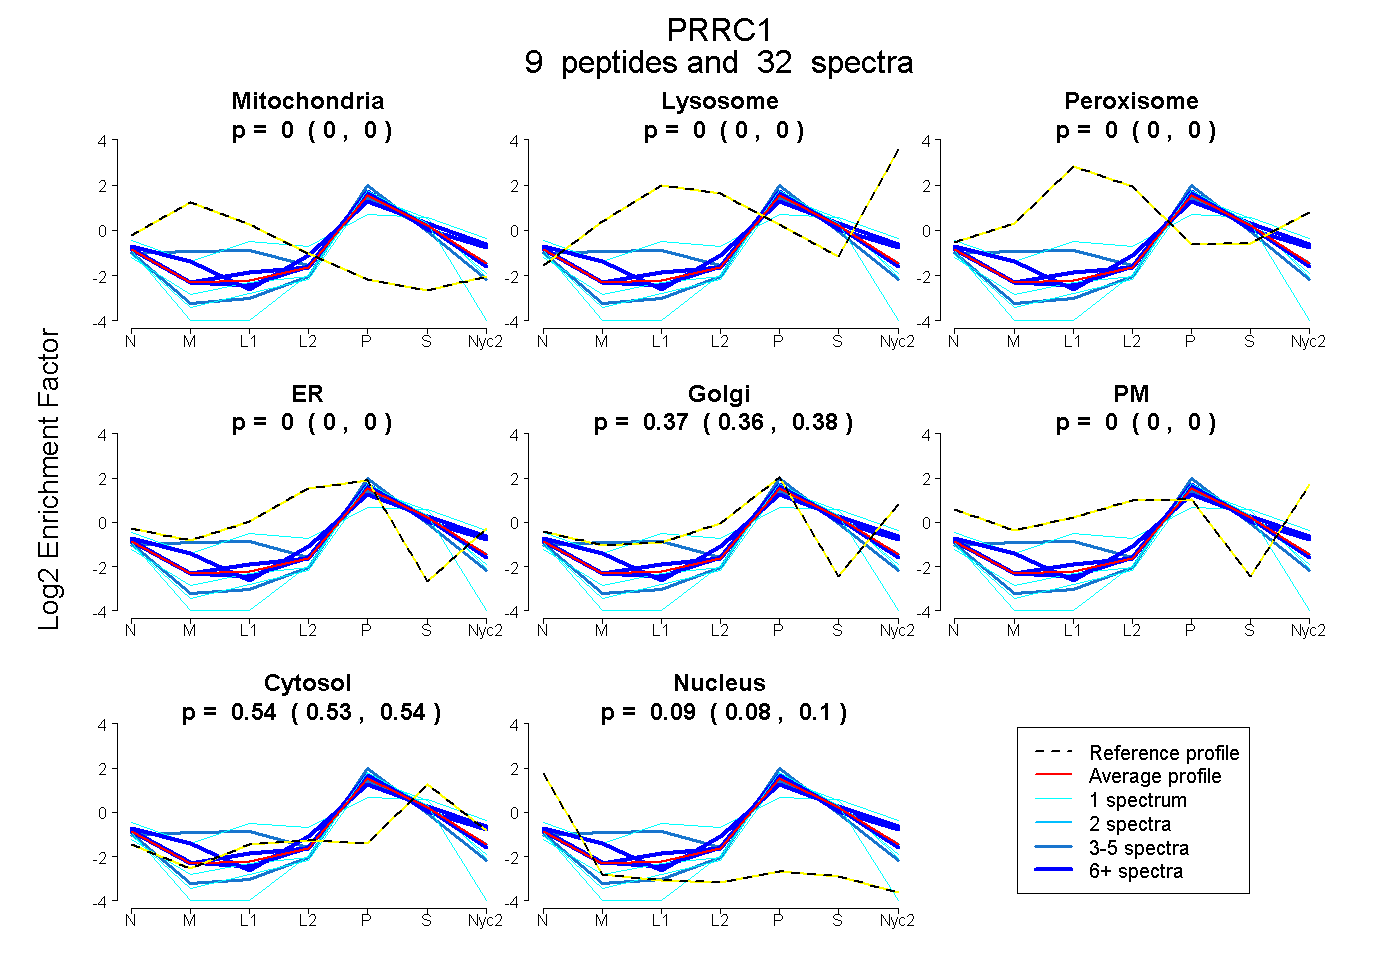
0.000 | 0.000
0.000 | 0.000
0.000 | 0.000
0.000 | 0.000
0.363 | 0.382
0.000 | 0.000
0.529 | 0.542
0.082 | 0.098
3peptides
spectra
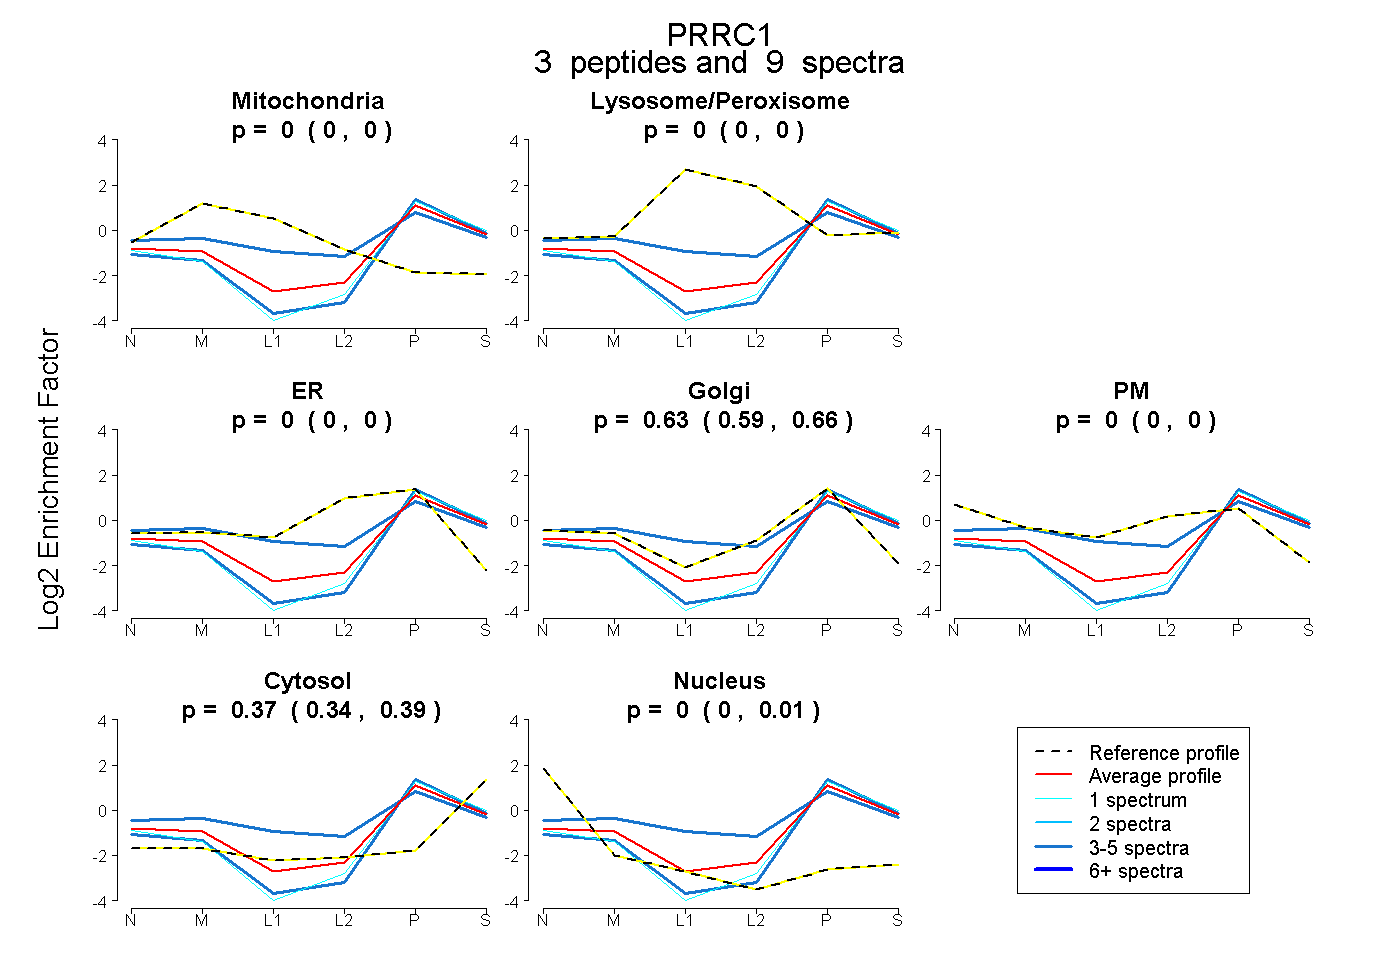
0.000 | 0.000
0.000 | 0.000
0.000 | 0.000
0.593 | 0.657
0.000 | 0.000
0.340 | 0.391
0.000 | 0.012
4peptides
spectra
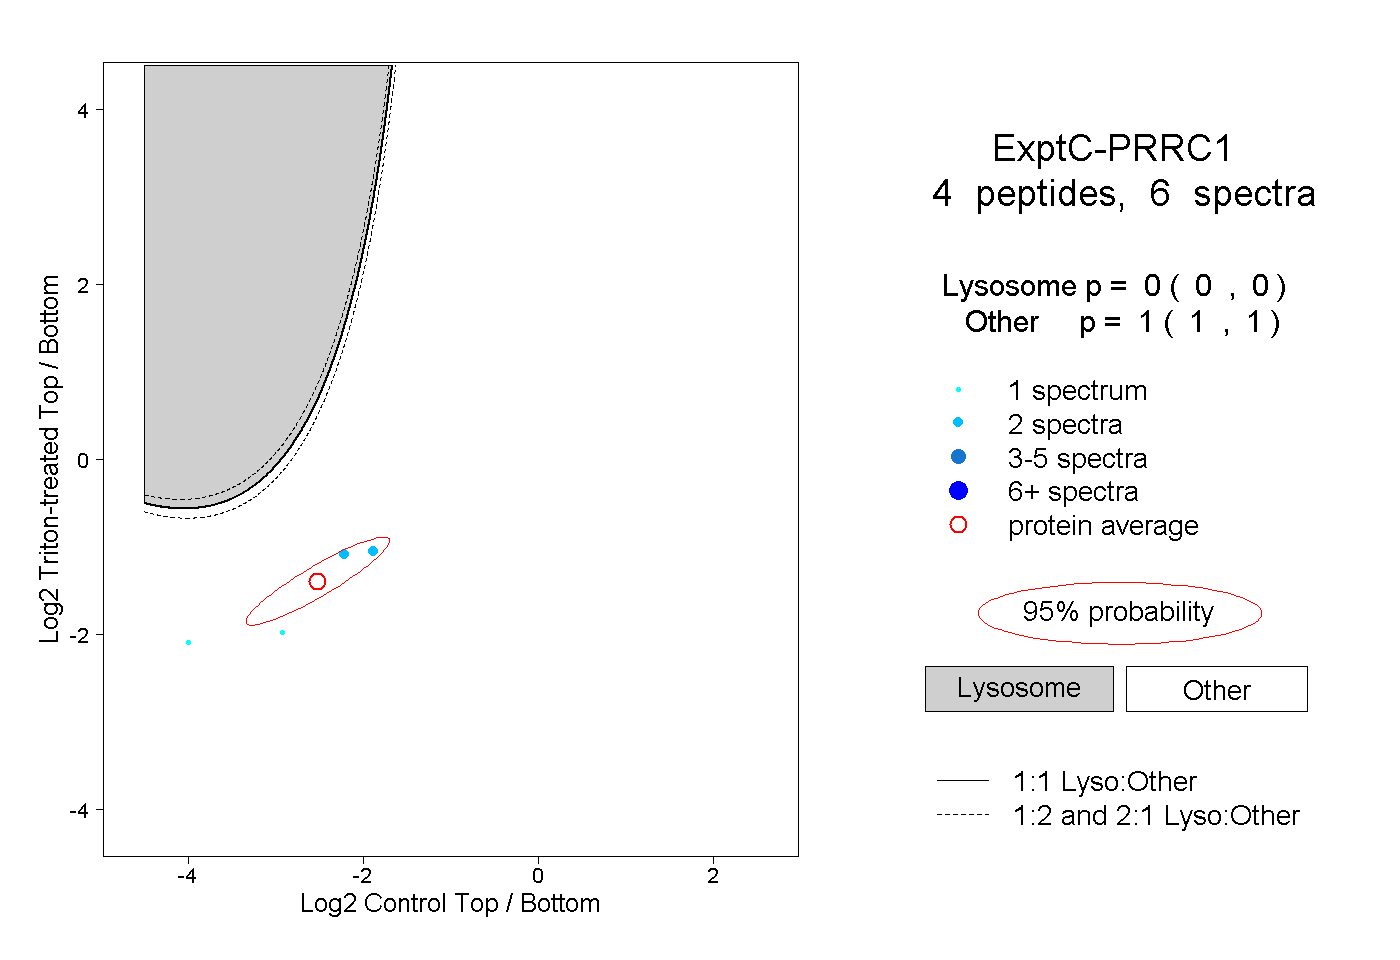
0.000 | 0.000
1.000 | 1.000
1peptide
spectrum
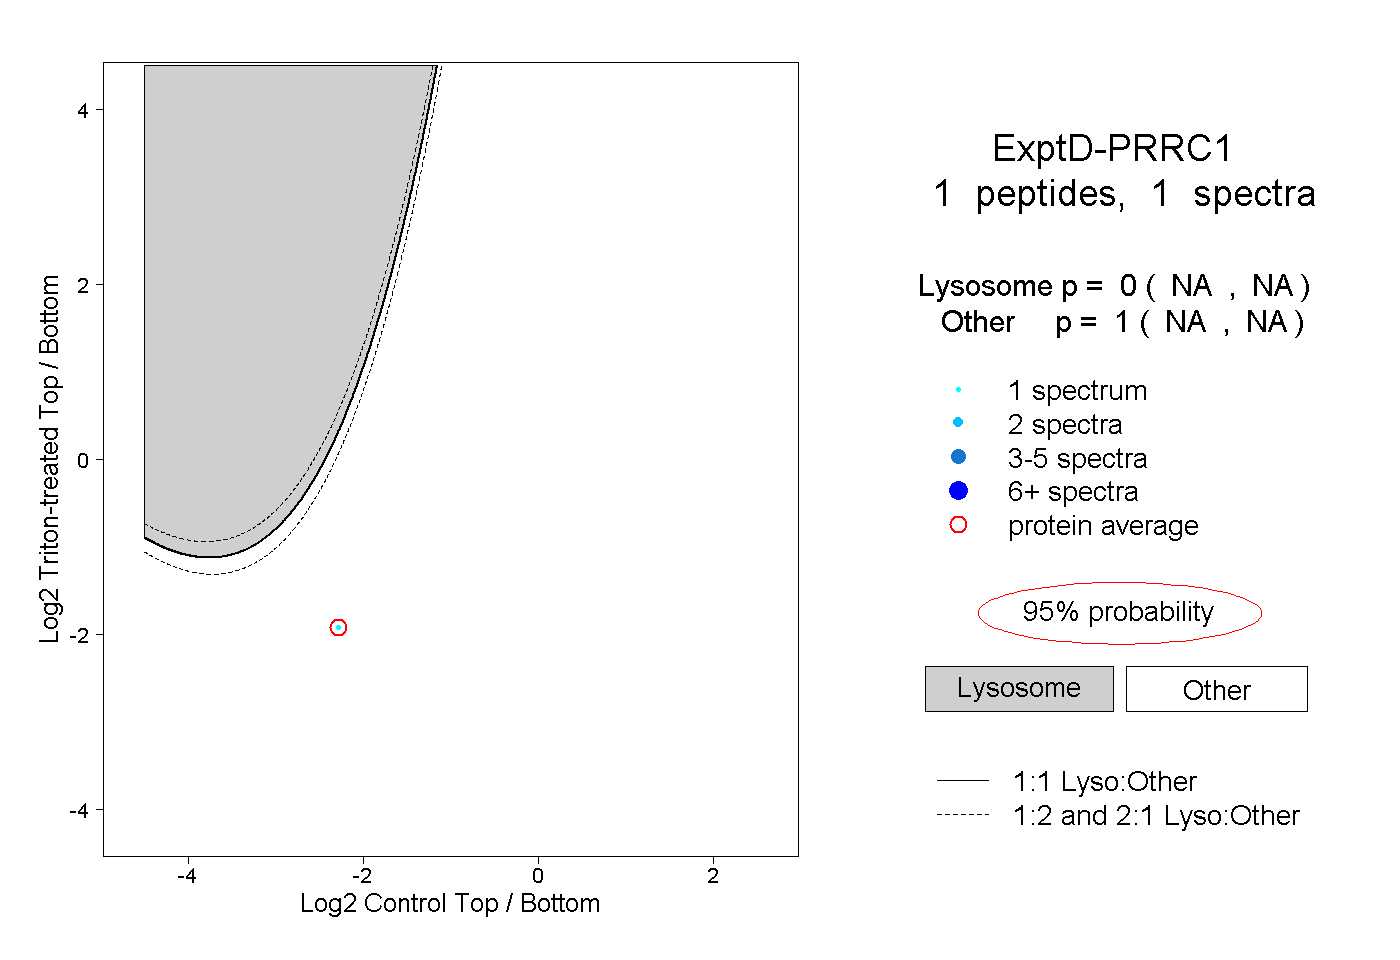
NA | NA
NA | NA