 9
9peptides
spectra
0.000 | 0.000
0.000 | 0.000
0.000 | 0.000
0.000 | 0.000
0.363 | 0.382
0.000 | 0.000
0.529 | 0.542
0.082 | 0.098
| Plot | Mito | Lyso | Perox | ER | Golgi | PM | Cytosol | Nucleus | |||||
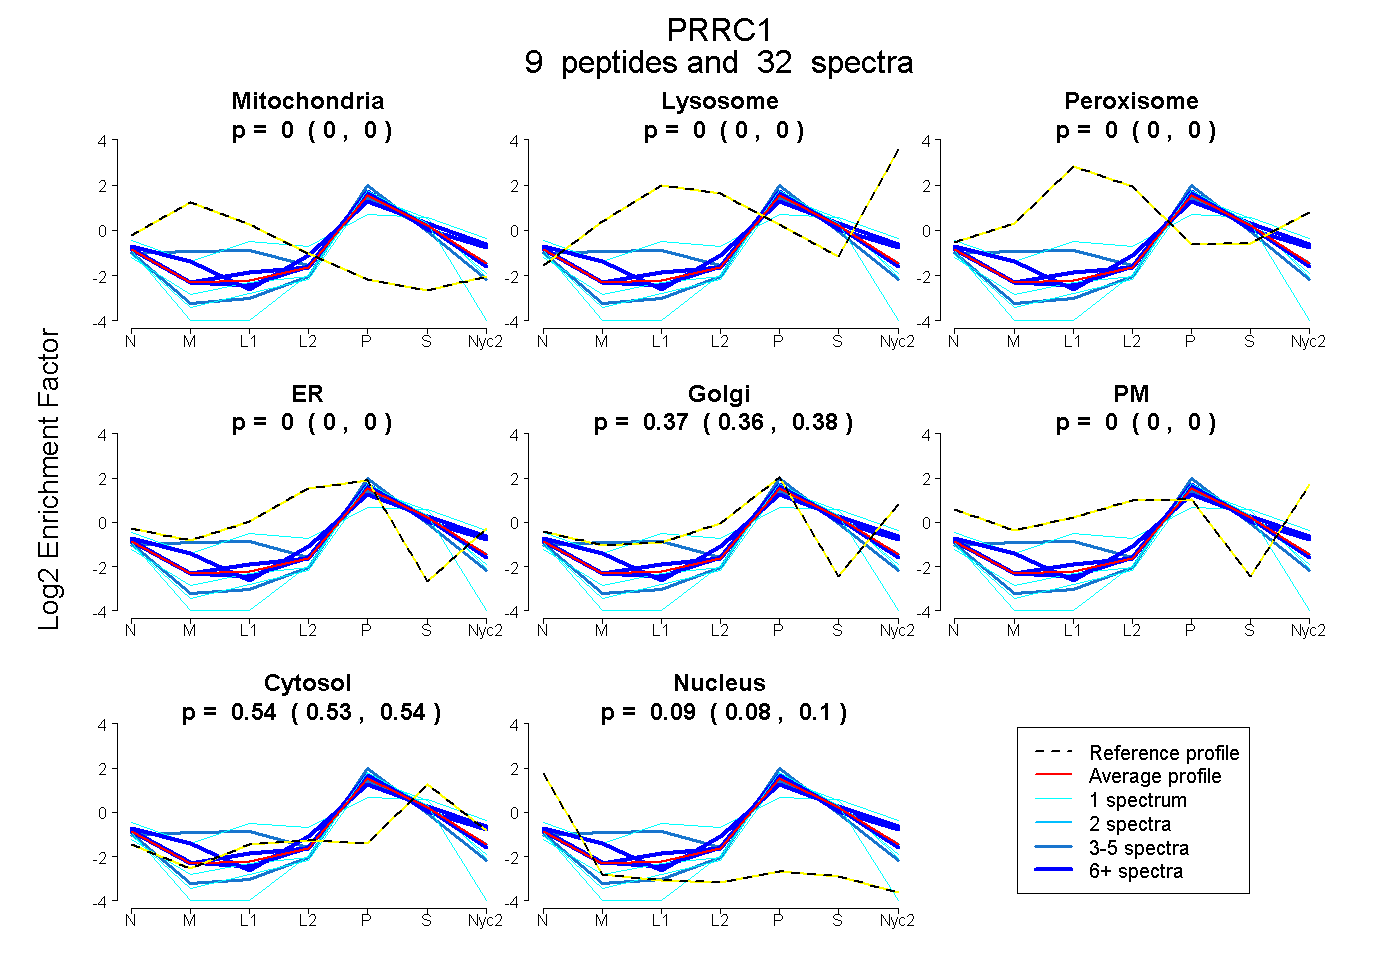
| Expt A |
9 peptides |
32 spectra |
|
0.000 0.000 | 0.000 |
0.000 0.000 | 0.000 |
0.000 0.000 | 0.000 |
0.000 0.000 | 0.000 |
0.373 0.363 | 0.382 |
0.000 0.000 | 0.000 |
0.536 0.529 | 0.542 |
0.090 0.082 | 0.098 |
| 7 spectra, SLLNVTR | 0.000 | 0.000 | 0.000 | 0.000 | 0.390 | 0.000 | 0.529 | 0.081 | ||
| 1 spectrum, SGGELDIVVTSNK | 0.000 | 0.000 | 0.000 | 0.000 | 0.209 | 0.000 | 0.630 | 0.161 | ||
| 3 spectra, GQDDAPAGGIWGFIK | 0.000 | 0.000 | 0.000 | 0.000 | 0.317 | 0.000 | 0.481 | 0.202 | ||
| 6 spectra, TDWHLAFTGMSR | 0.000 | 0.000 | 0.000 | 0.000 | 0.450 | 0.000 | 0.526 | 0.024 | ||
| 1 spectrum, LPPRPL | 0.000 | 0.000 | 0.000 | 0.000 | 0.306 | 0.000 | 0.583 | 0.110 | ||
| 7 spectra, GVAGNPMVK | 0.000 | 0.000 | 0.000 | 0.000 | 0.452 | 0.000 | 0.494 | 0.053 | ||
| 5 spectra, ALAGMYK | 0.078 | 0.000 | 0.000 | 0.000 | 0.428 | 0.000 | 0.494 | 0.000 | ||
| 1 spectrum, WSGLLVTVGEVLEK | 0.000 | 0.000 | 0.000 | 0.000 | 0.092 | 0.000 | 0.542 | 0.366 | ||
| 1 spectrum, SGTIHEK | 0.000 | 0.000 | 0.127 | 0.000 | 0.342 | 0.000 | 0.532 | 0.000 |
| Plot | Mito | Lyso or Perox | ER | Golgi | PM | Cytosol | Nucleus | ||||||
| Expt B |
3 peptides |
9 spectra |
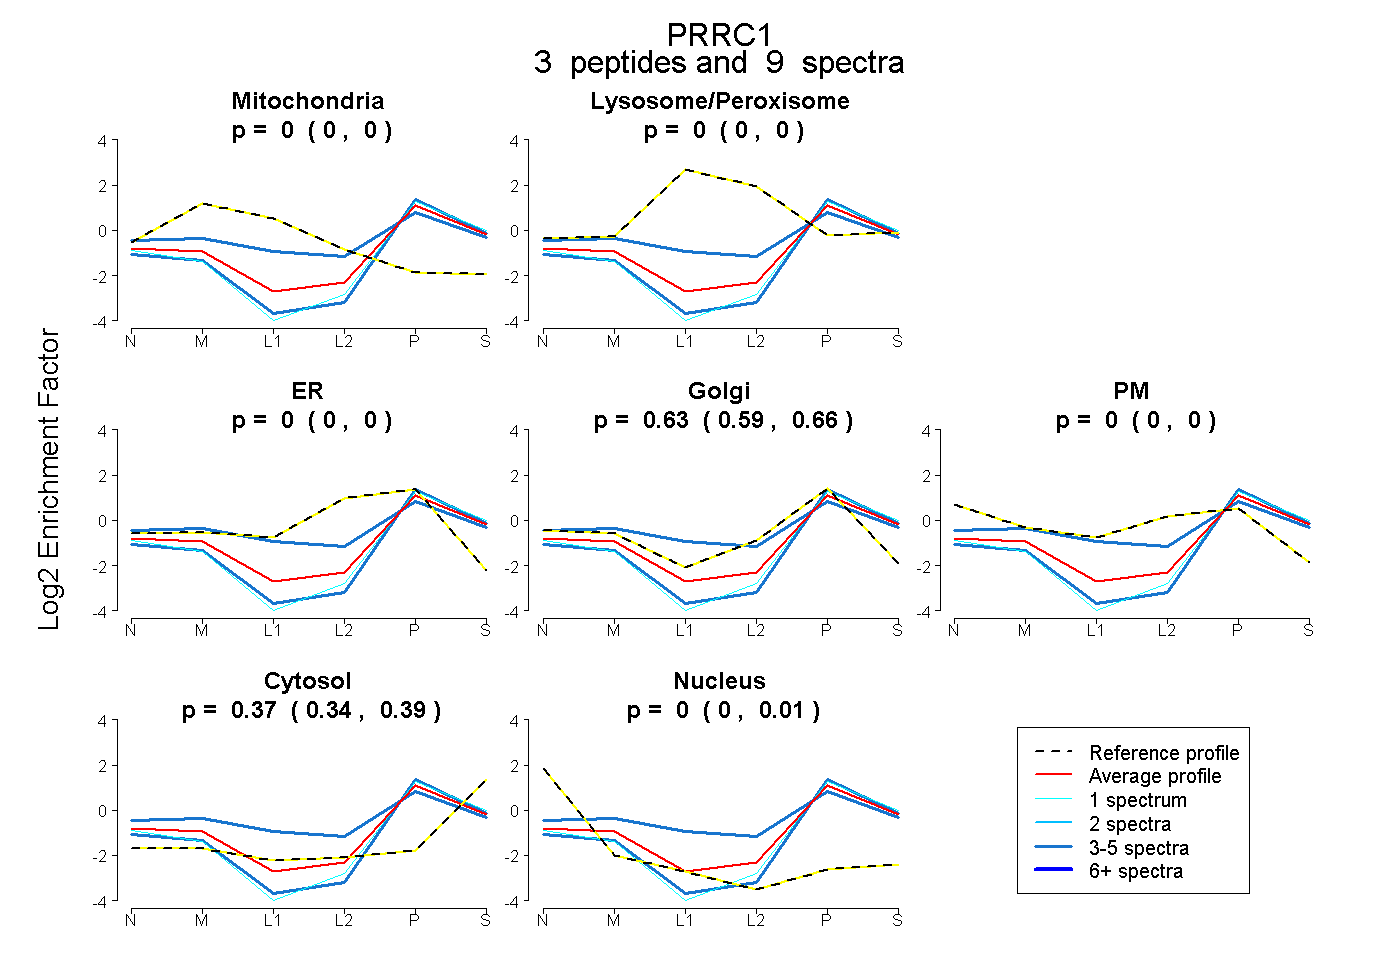 |
0.000 0.000 | 0.000 |
0.000 0.000 | 0.000 |
0.000 0.000 | 0.000 |
0.631 0.593 | 0.657 |
0.000 0.000 | 0.000 |
0.369 0.340 | 0.391 |
0.000 0.000 | 0.012 |
|||
| Plot | Lyso | Other | |||||||||||
| Expt C |
4 peptides |
6 spectra |
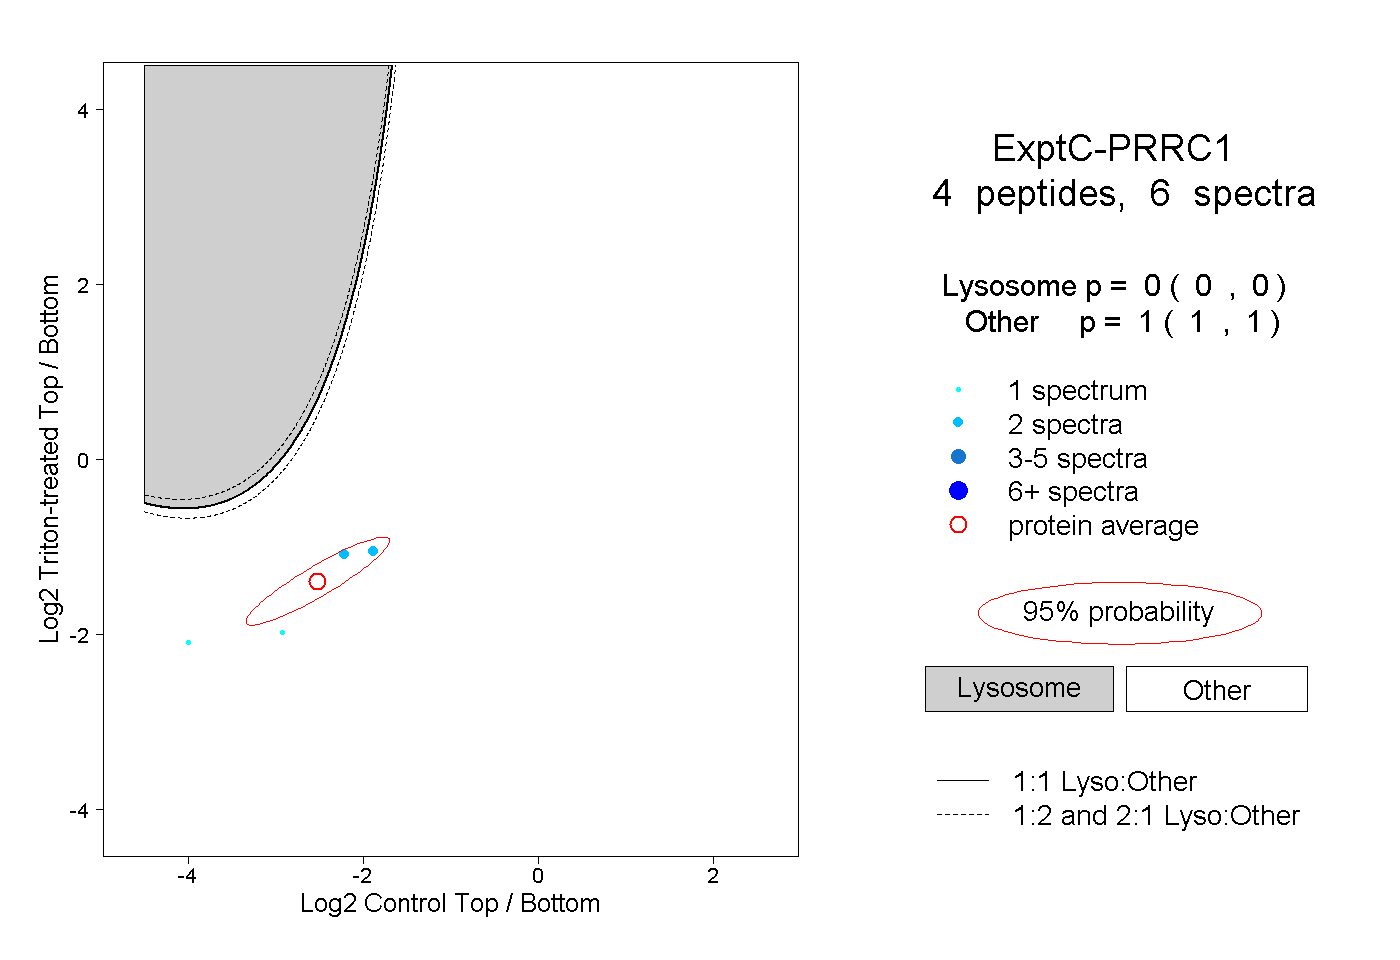 |
0.000 0.000 | 0.000 |
1.000 1.000 | 1.000 |
||||||||
| Plot | Lyso | Other | |||||||||||
| Expt D |
1 peptide |
1 spectrum |
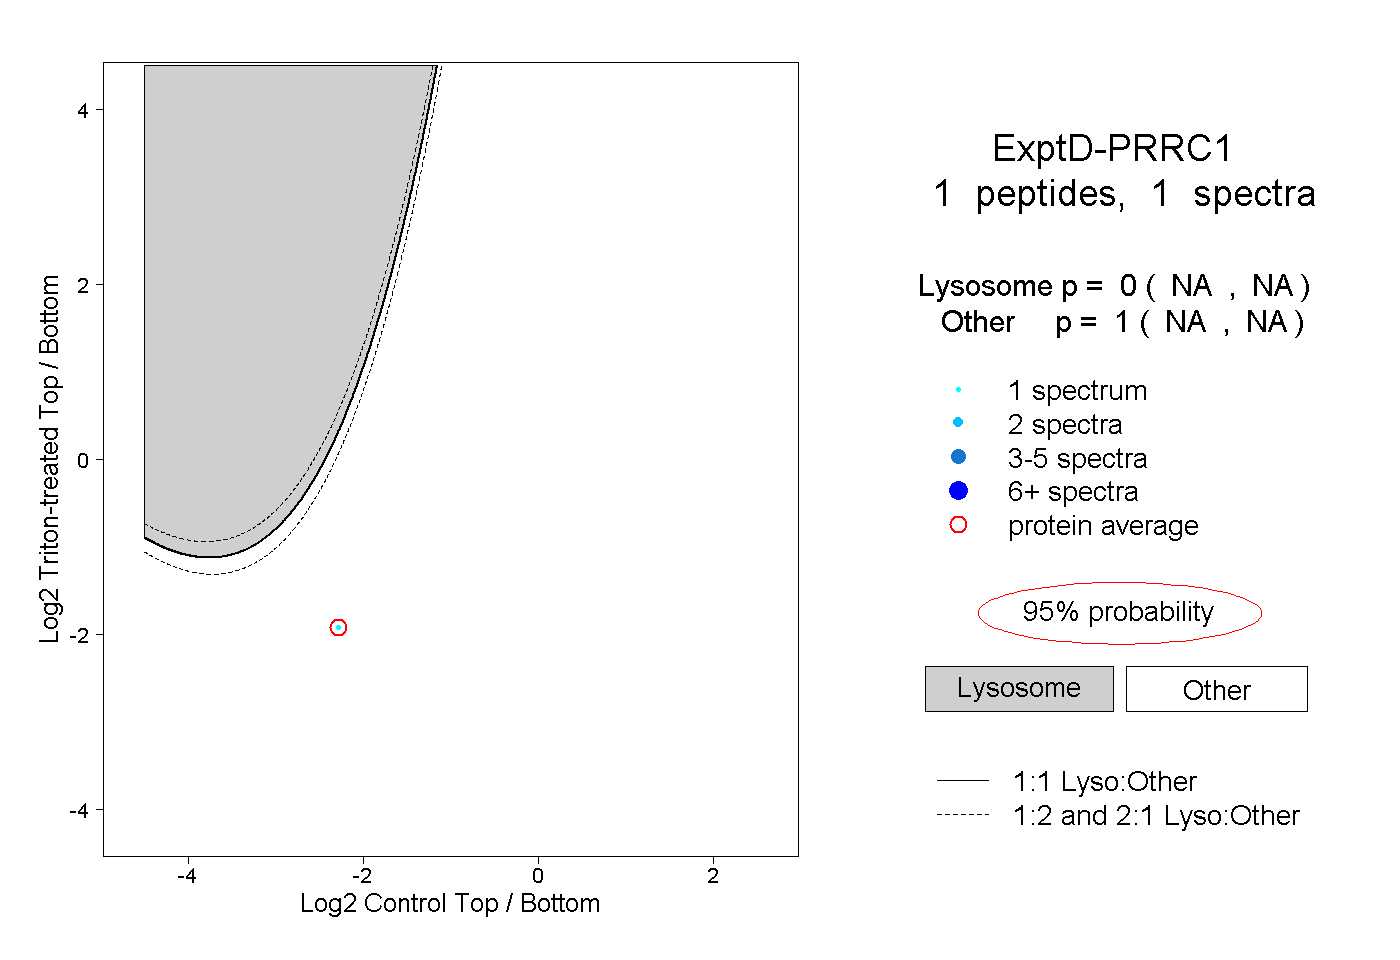 |
0.000 NA | NA |
1.000 NA | NA |