 10
10peptides
spectra
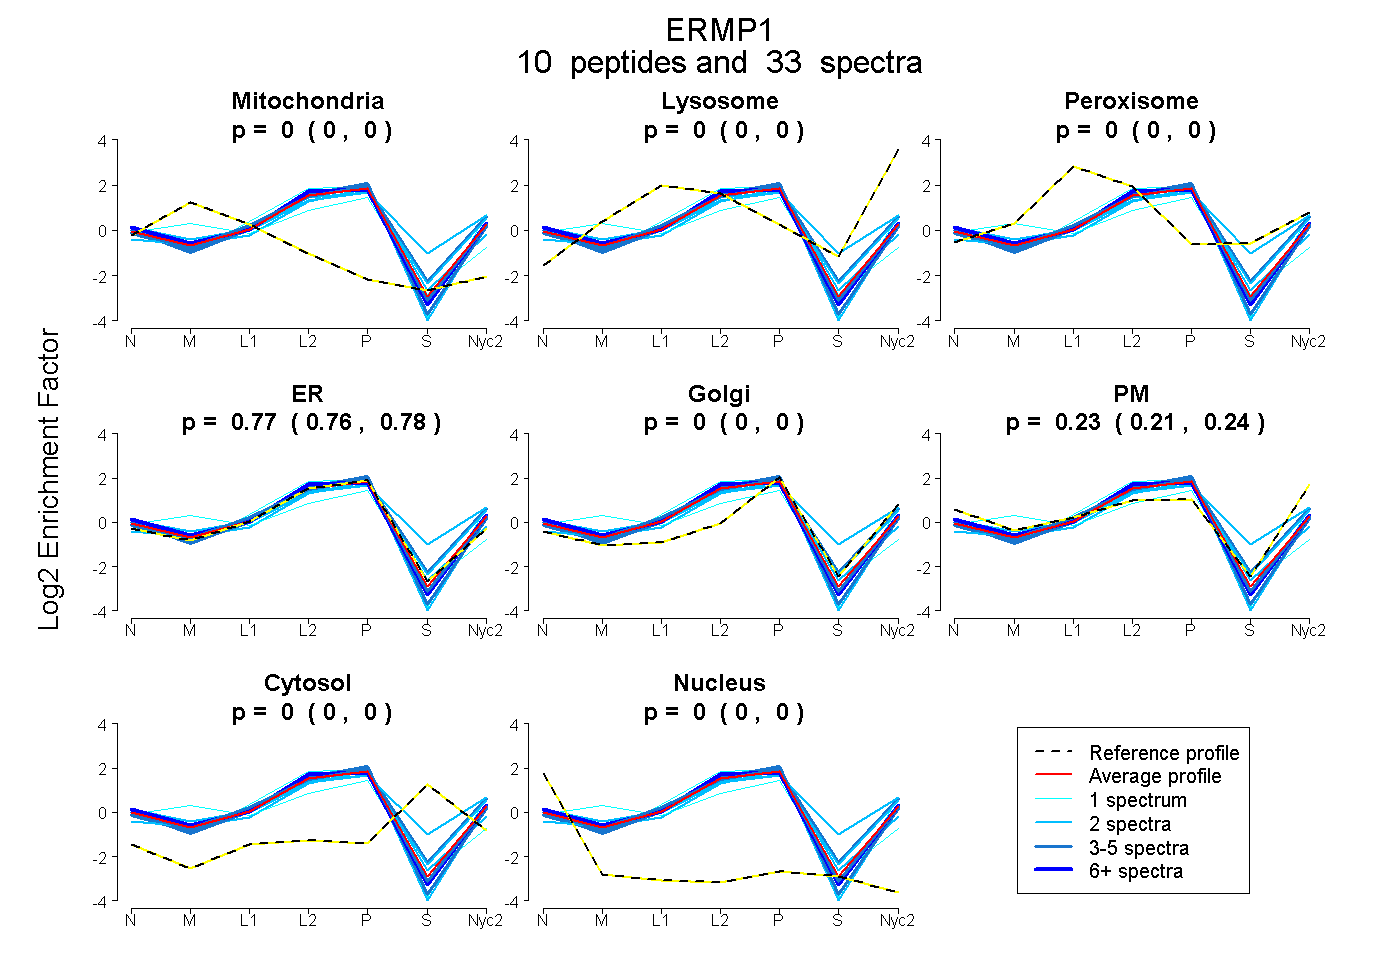
0.000 | 0.000
0.000 | 0.000
0.000 | 0.000
0.756 | 0.783
0.000 | 0.000
0.214 | 0.242
0.000 | 0.000
0.000 | 0.000
9peptides
spectra
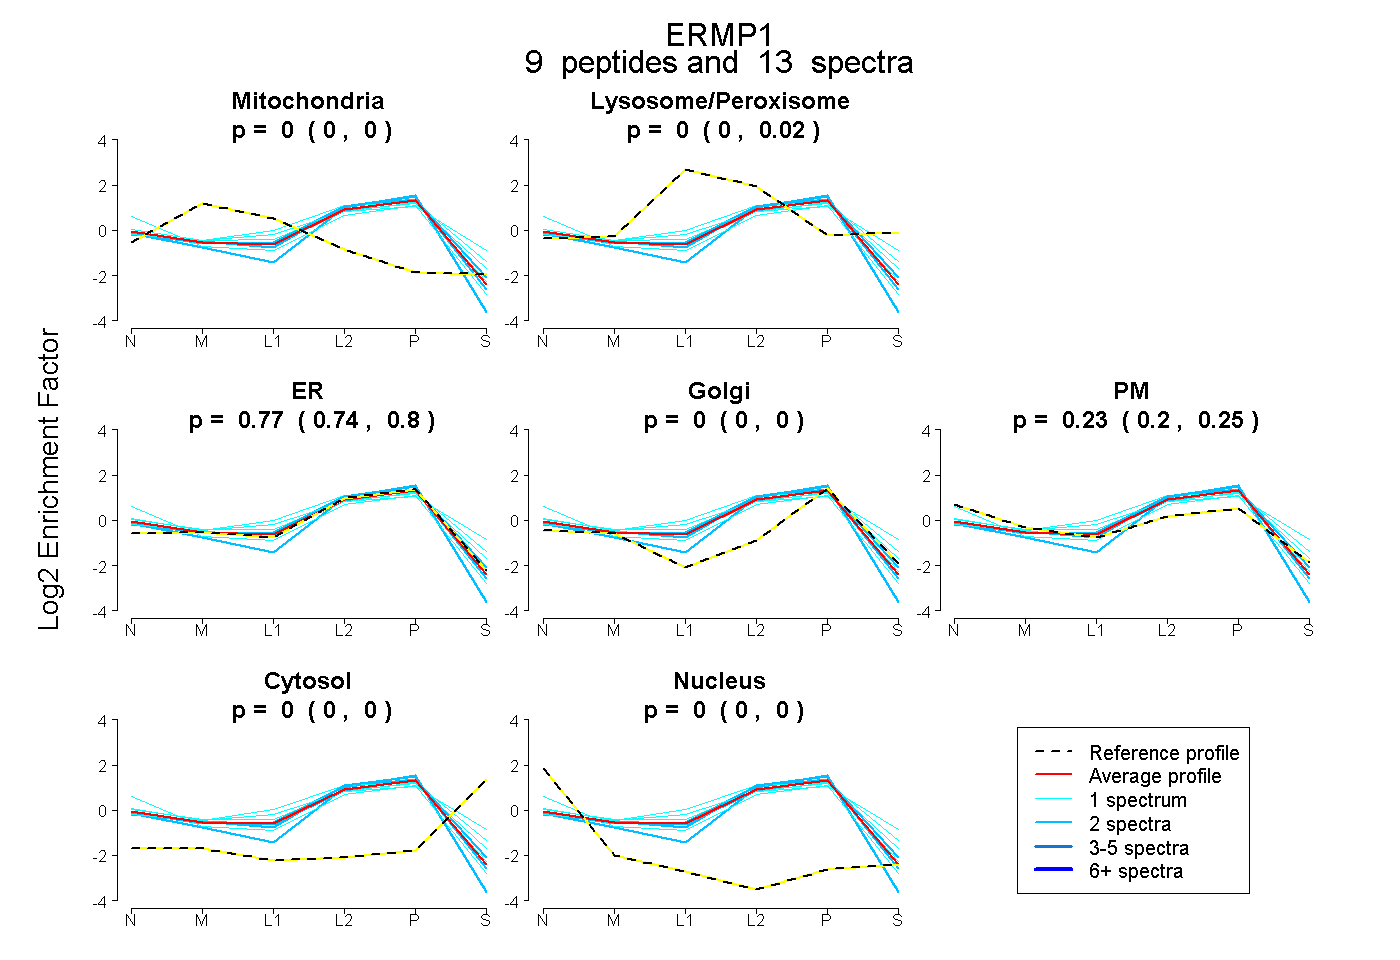
0.000 | 0.000
0.000 | 0.015
0.739 | 0.795
0.000 | 0.000
0.200 | 0.249
0.000 | 0.000
0.000 | 0.000
8peptides
spectra
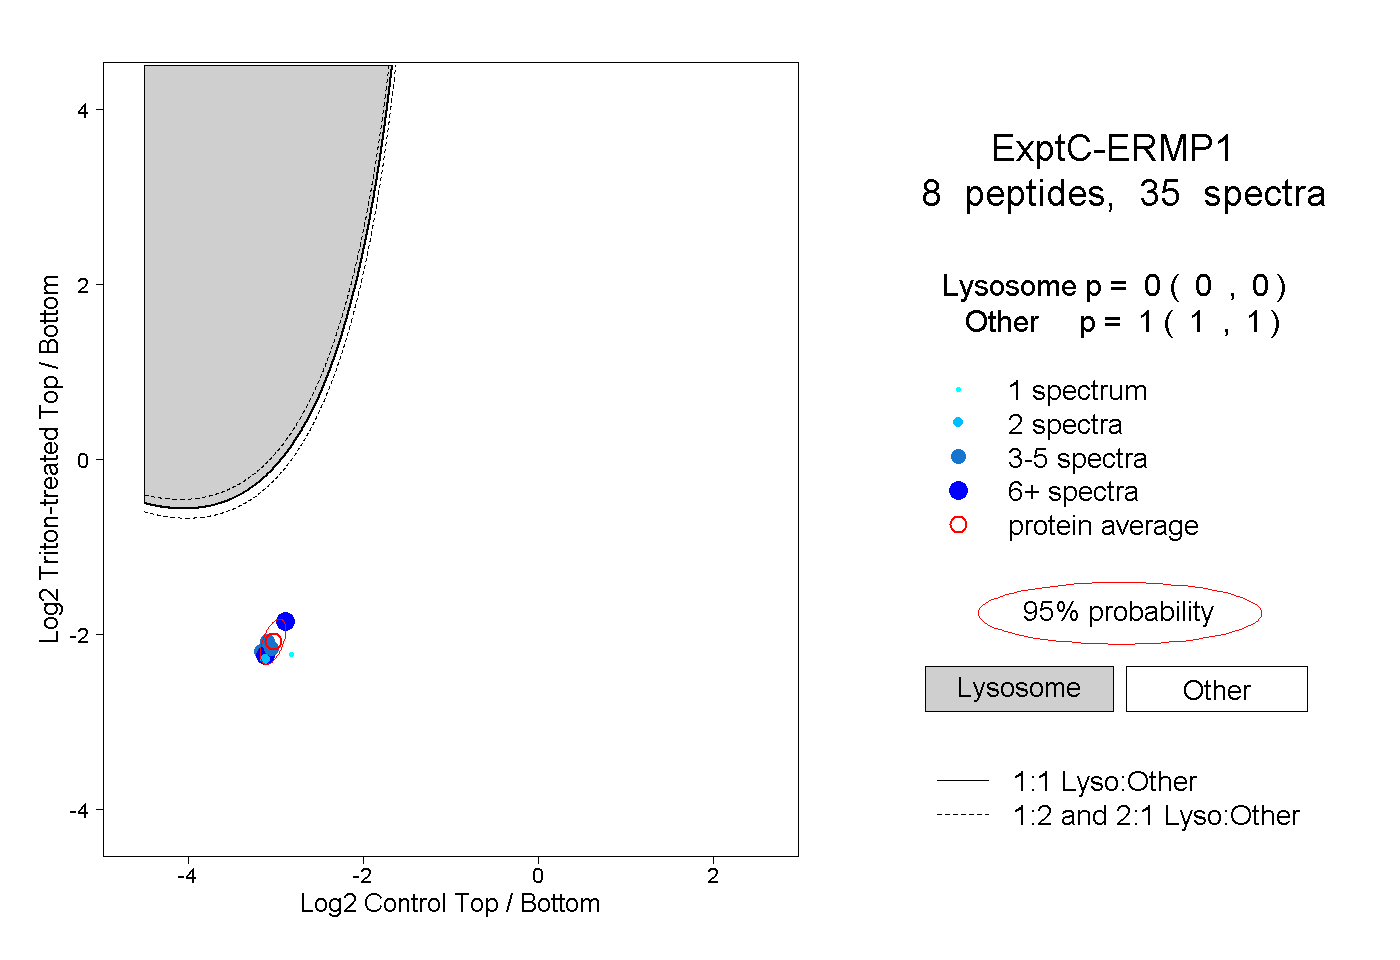
0.000 | 0.000
1.000 | 1.000
5peptides
spectra
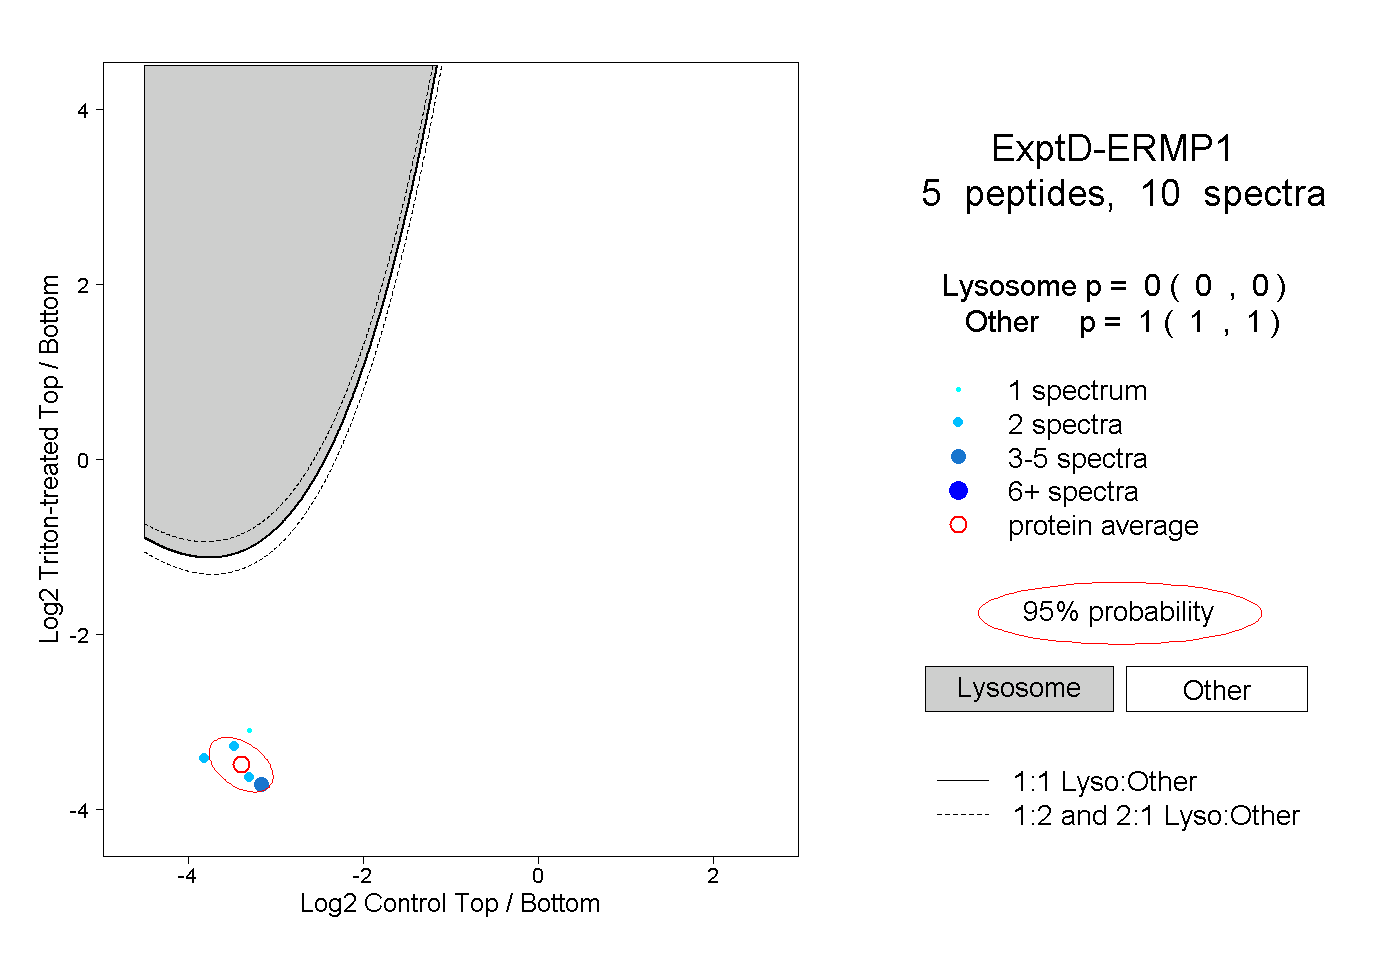
0.000 | 0.000
1.000 | 1.000