 10
10peptides
spectra
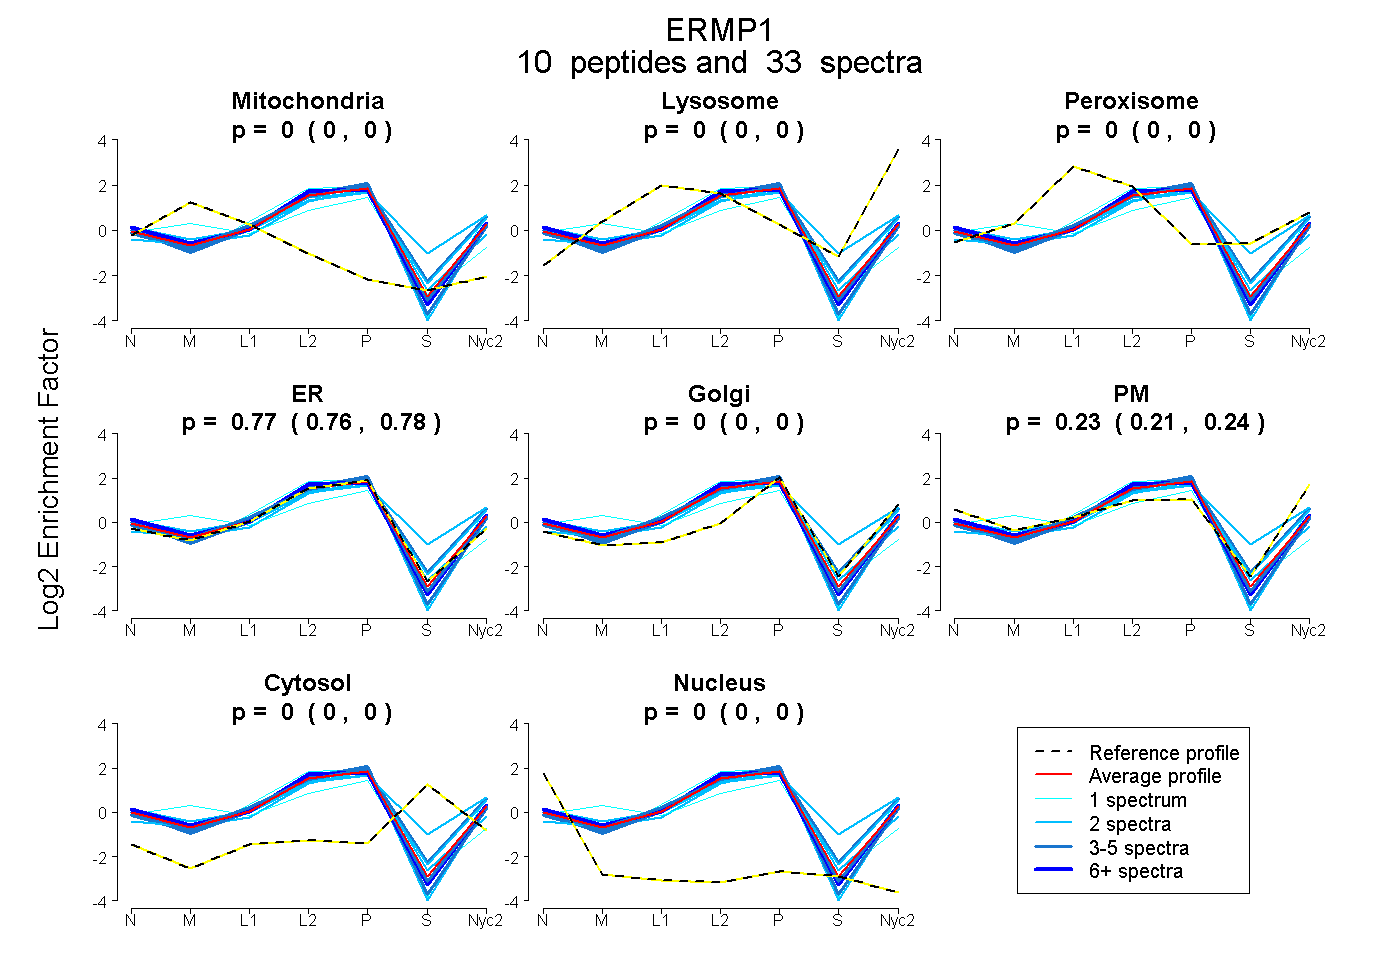
0.000 | 0.000
0.000 | 0.000
0.000 | 0.000
0.756 | 0.783
0.000 | 0.000
0.214 | 0.242
0.000 | 0.000
0.000 | 0.000
| Plot | Mito | Lyso | Perox | ER | Golgi | PM | Cytosol | Nucleus | |||||
| Expt A |
10 peptides |
33 spectra |
|
0.000 0.000 | 0.000 |
0.000 0.000 | 0.000 |
0.000 0.000 | 0.000 |
0.771 0.756 | 0.783 |
0.000 0.000 | 0.000 |
0.229 0.214 | 0.242 |
0.000 0.000 | 0.000 |
0.000 0.000 | 0.000 |
| 2 spectra, NSNYVR | 0.000 | 0.011 | 0.009 | 0.599 | 0.000 | 0.381 | 0.000 | 0.000 | ||
| 4 spectra, IILIHTLAK | 0.000 | 0.045 | 0.000 | 0.656 | 0.056 | 0.243 | 0.000 | 0.000 | ||
| 2 spectra, MPWDSIK | 0.000 | 0.220 | 0.000 | 0.566 | 0.081 | 0.000 | 0.133 | 0.000 | ||
| 2 spectra, ALVQLSLQR | 0.006 | 0.000 | 0.000 | 0.827 | 0.086 | 0.061 | 0.000 | 0.020 | ||
| 1 spectrum, EGQAAASHPQR | 0.220 | 0.000 | 0.000 | 0.743 | 0.037 | 0.000 | 0.000 | 0.000 | ||
| 1 spectrum, GSTLSQWSLGNGIPVTSR | 0.000 | 0.000 | 0.000 | 0.699 | 0.000 | 0.301 | 0.000 | 0.000 | ||
| 4 spectra, ILIDSIQR | 0.000 | 0.000 | 0.000 | 0.908 | 0.000 | 0.092 | 0.000 | 0.000 | ||
| 2 spectra, AGDNILAVLK | 0.000 | 0.000 | 0.000 | 0.849 | 0.000 | 0.151 | 0.000 | 0.000 | ||
| 4 spectra, VYLEHITAIGPR | 0.000 | 0.000 | 0.000 | 0.801 | 0.000 | 0.199 | 0.000 | 0.000 | ||
| 11 spectra, TALSEAR | 0.000 | 0.000 | 0.000 | 0.749 | 0.000 | 0.251 | 0.000 | 0.000 |
| Plot | Mito | Lyso or Perox | ER | Golgi | PM | Cytosol | Nucleus | ||||||
| Expt B |
9 peptides |
13 spectra |
 |
0.000 0.000 | 0.000 |
0.000 0.000 | 0.015 |
0.773 0.739 | 0.795 |
0.000 0.000 | 0.000 |
0.227 0.200 | 0.249 |
0.000 0.000 | 0.000 |
0.000 0.000 | 0.000 |
|||
| Plot | Lyso | Other | |||||||||||
| Expt C |
8 peptides |
35 spectra |
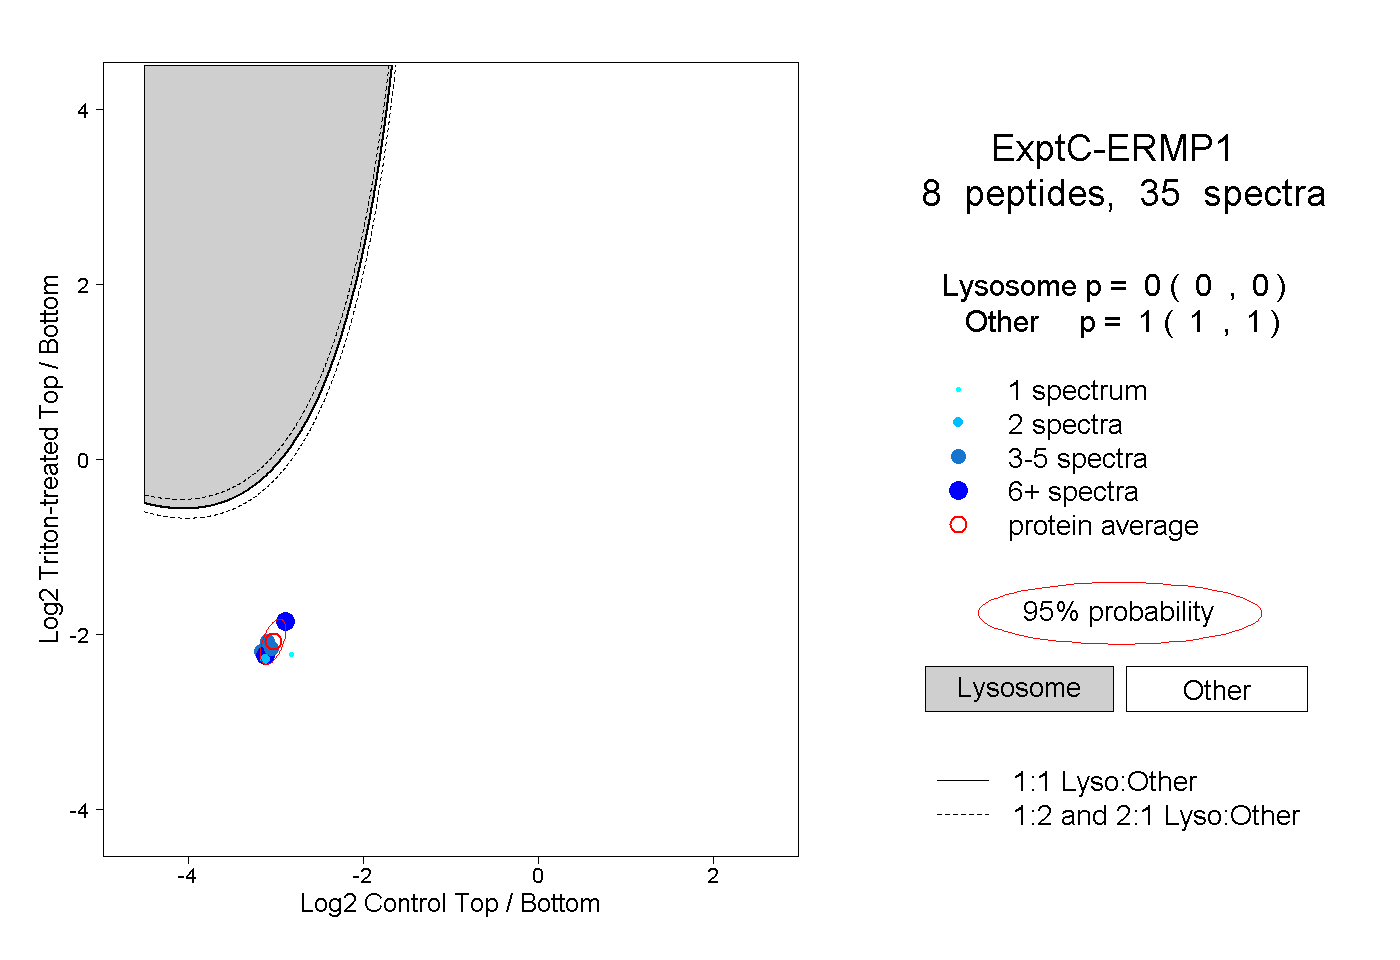 |
0.000 0.000 | 0.000 |
1.000 1.000 | 1.000 |
||||||||
| Plot | Lyso | Other | |||||||||||
| Expt D |
5 peptides |
10 spectra |
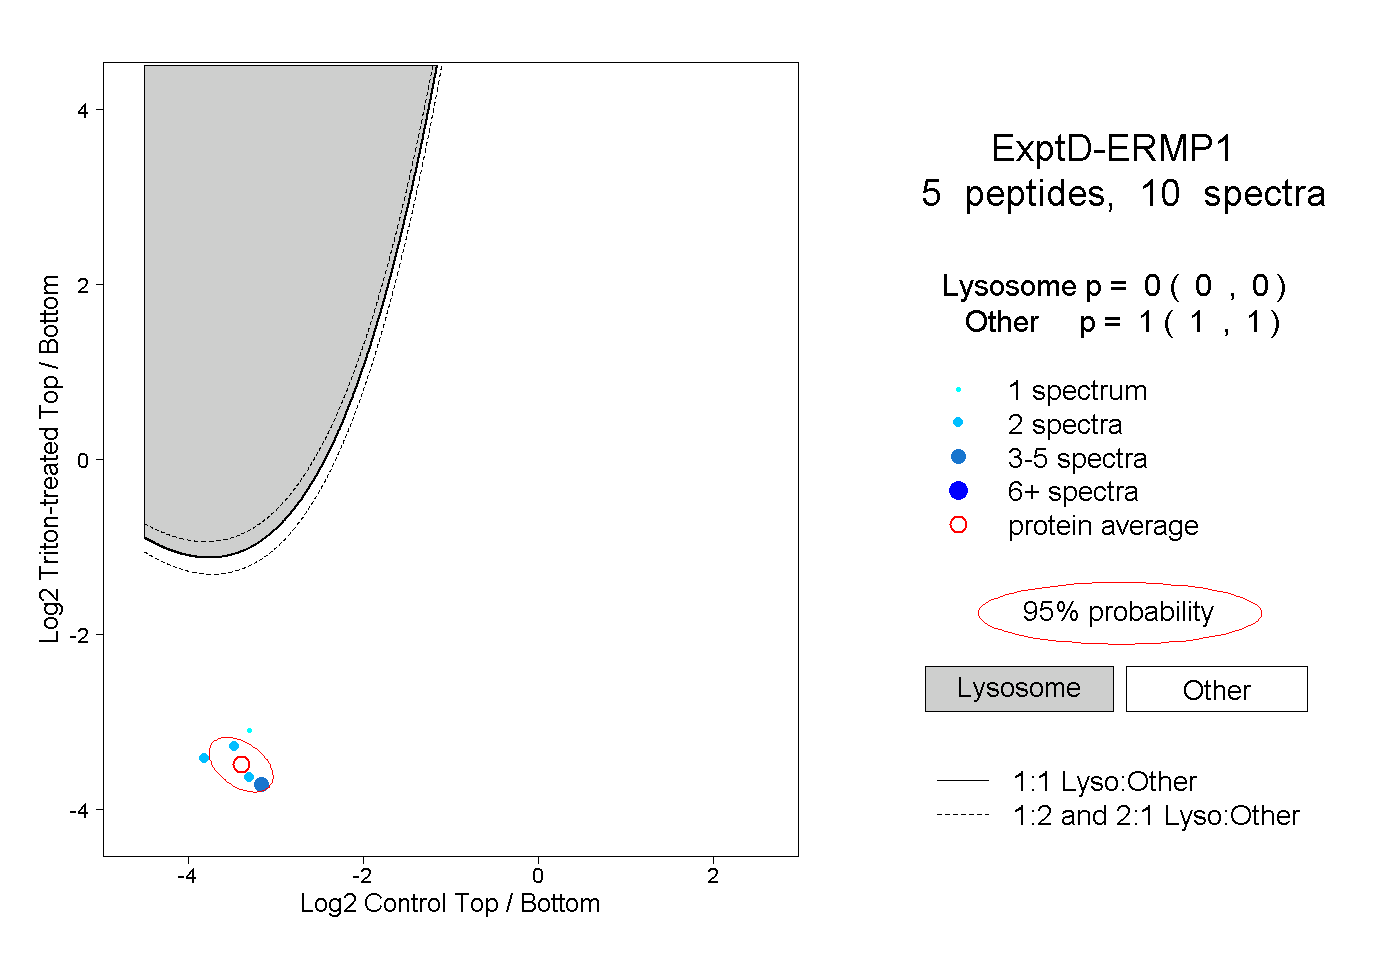 |
0.000 0.000 | 0.000 |
1.000 1.000 | 1.000 |