 9
9peptides
spectra
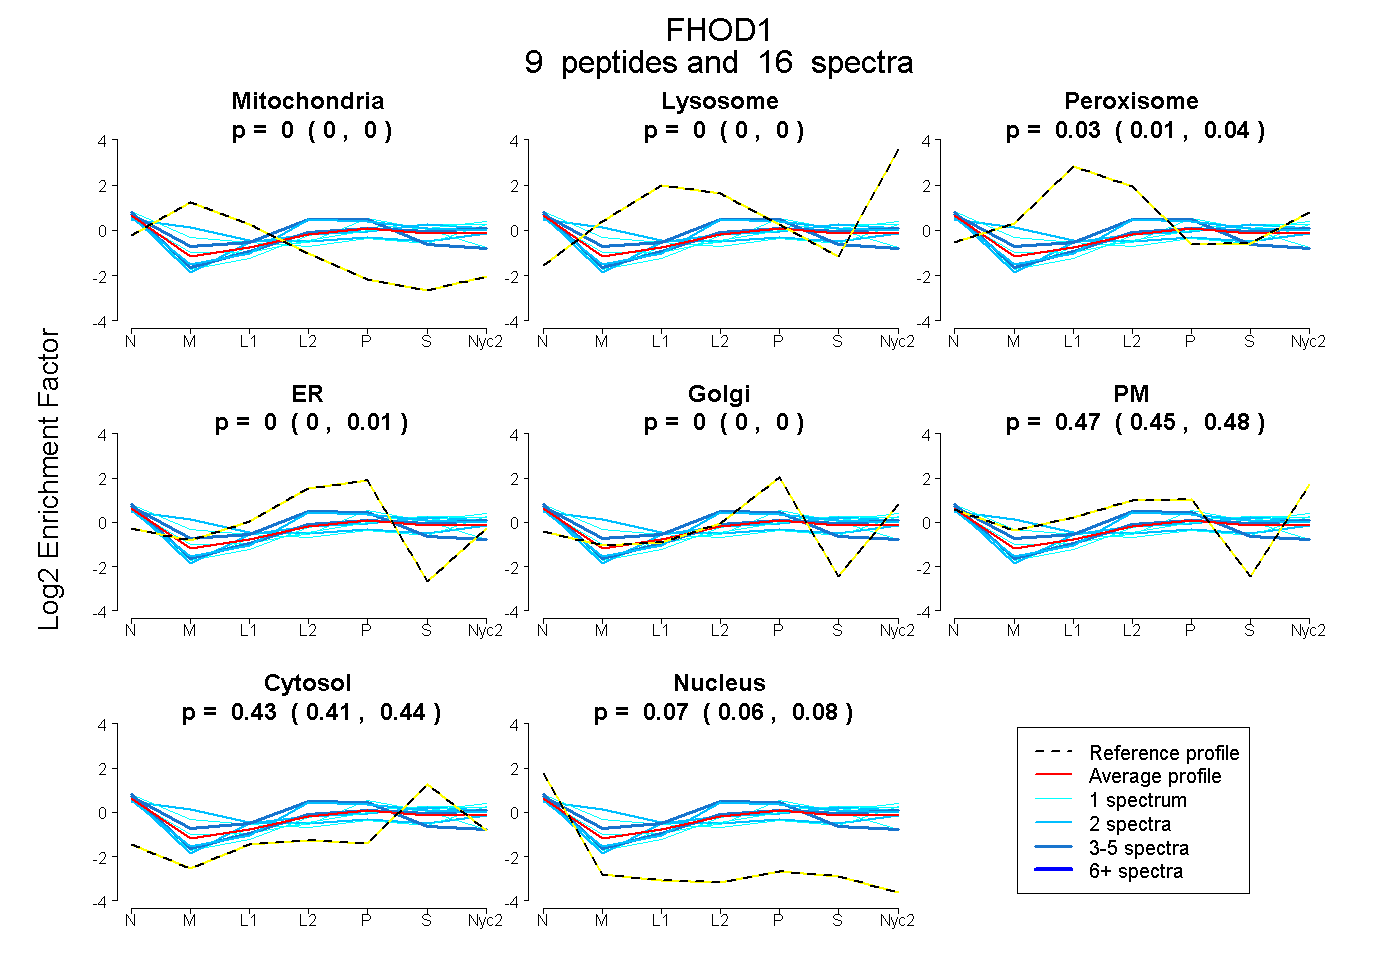
0.000 | 0.000
0.000 | 0.000
0.009 | 0.043
0.000 | 0.010
0.000 | 0.000
0.450 | 0.484
0.413 | 0.442
0.062 | 0.081
1peptide
spectrum
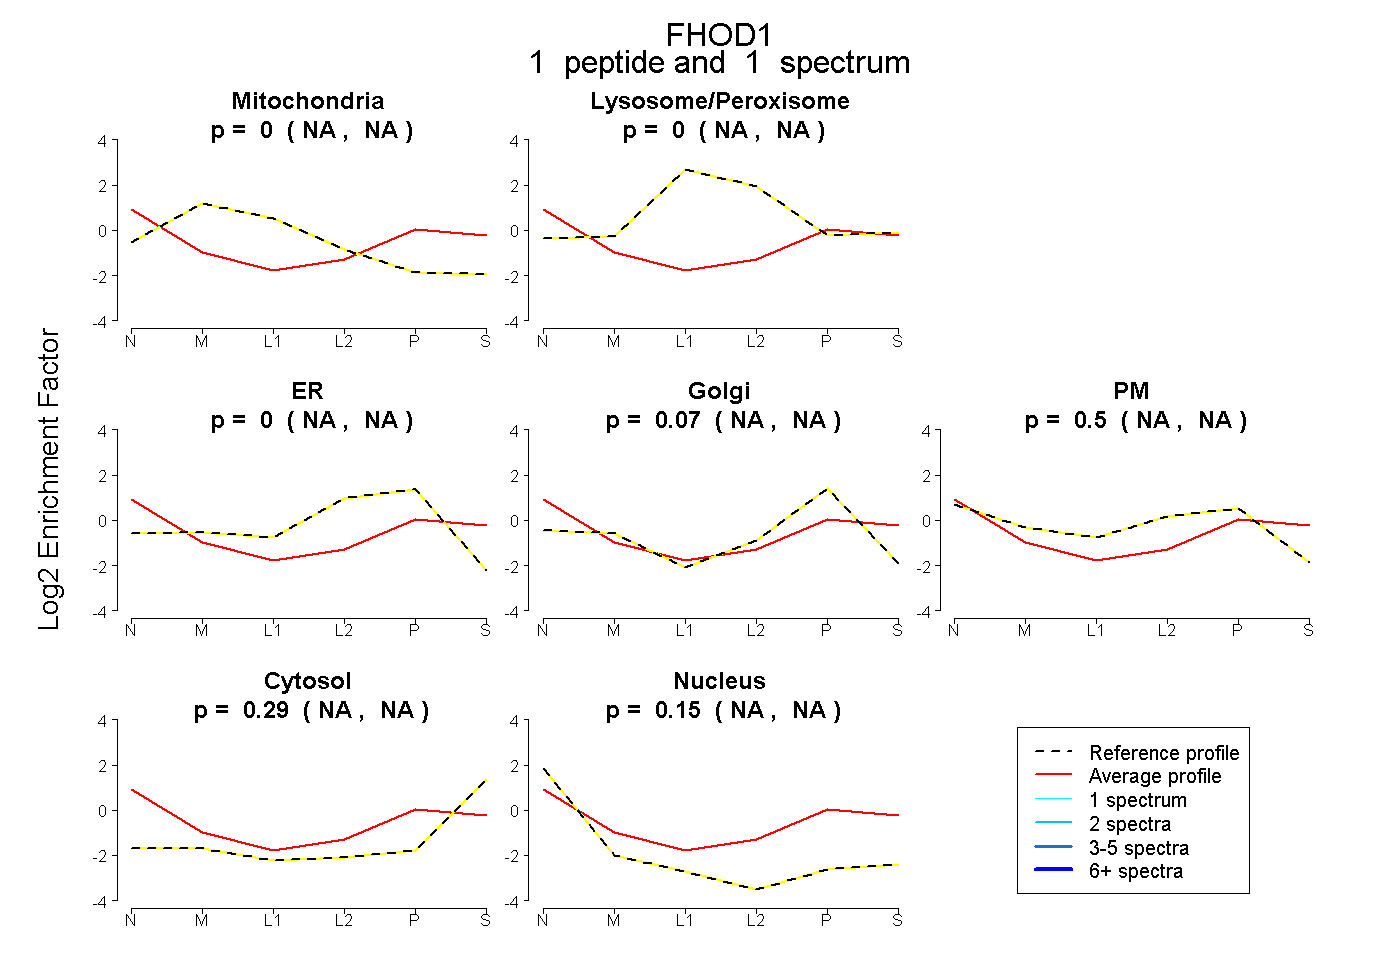
NA | NA
NA | NA
NA | NA
NA | NA
NA | NA
NA | NA
NA | NA
5peptides
spectra
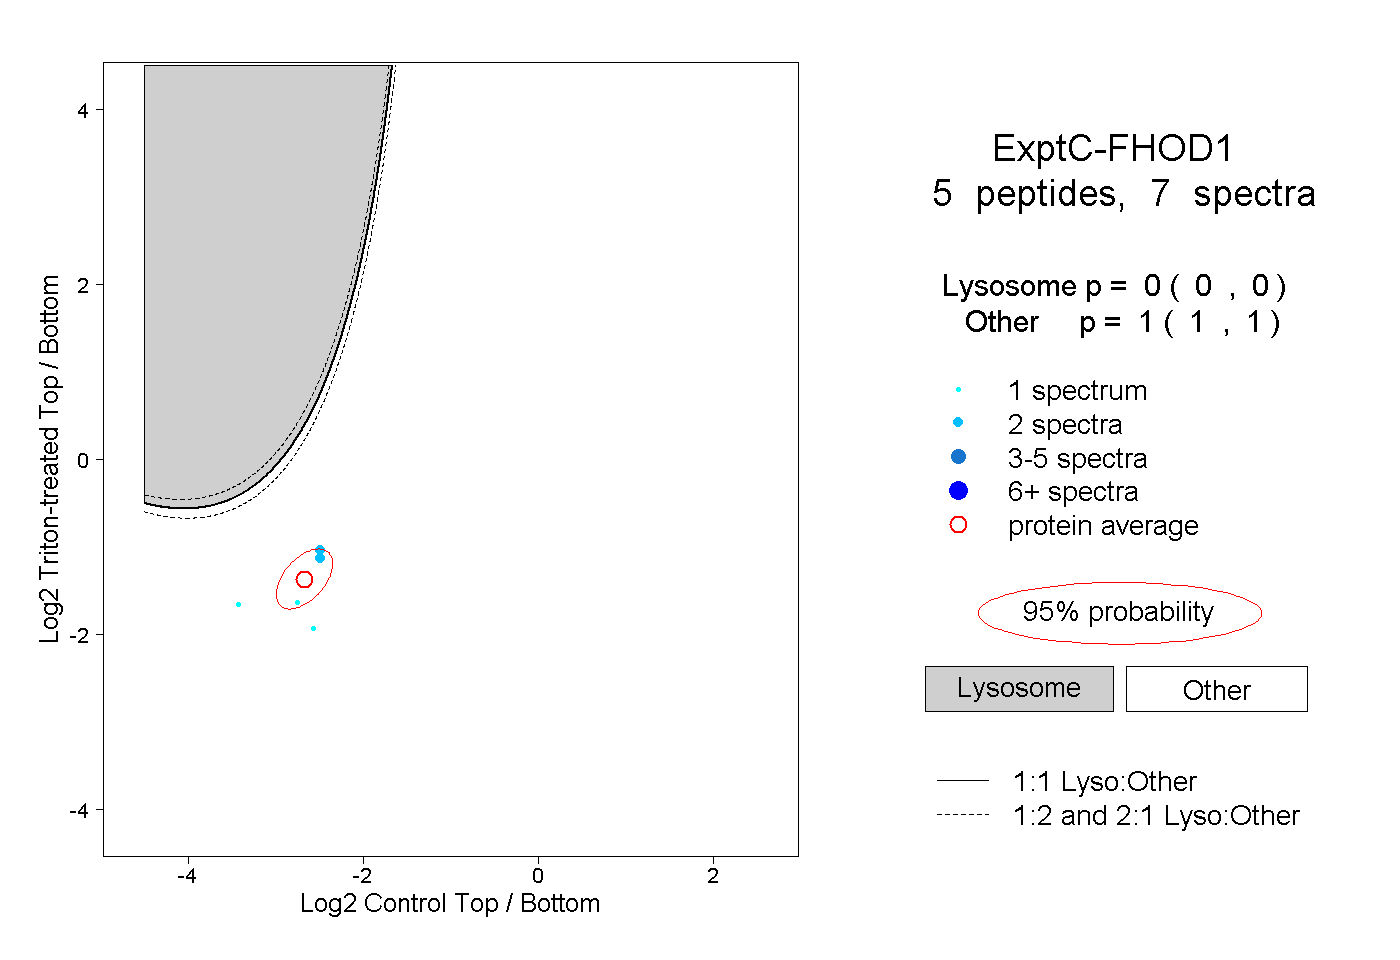
0.000 | 0.000
1.000 | 1.000
1peptide
spectrum
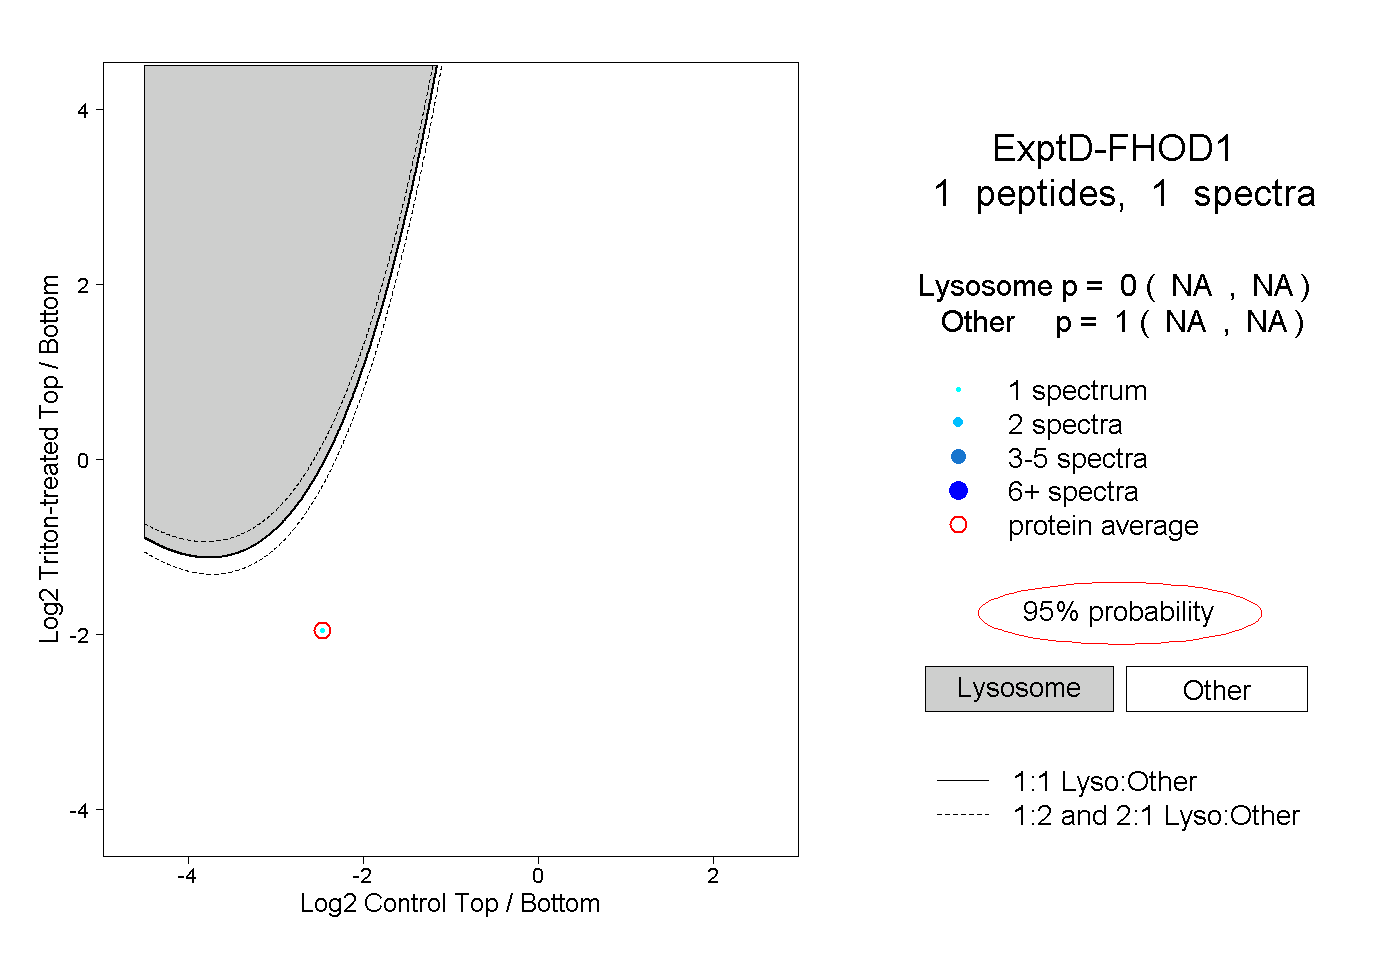
NA | NA
NA | NA