 9
9peptides
spectra
0.000 | 0.000
0.000 | 0.000
0.009 | 0.043
0.000 | 0.010
0.000 | 0.000
0.450 | 0.484
0.413 | 0.442
0.062 | 0.081
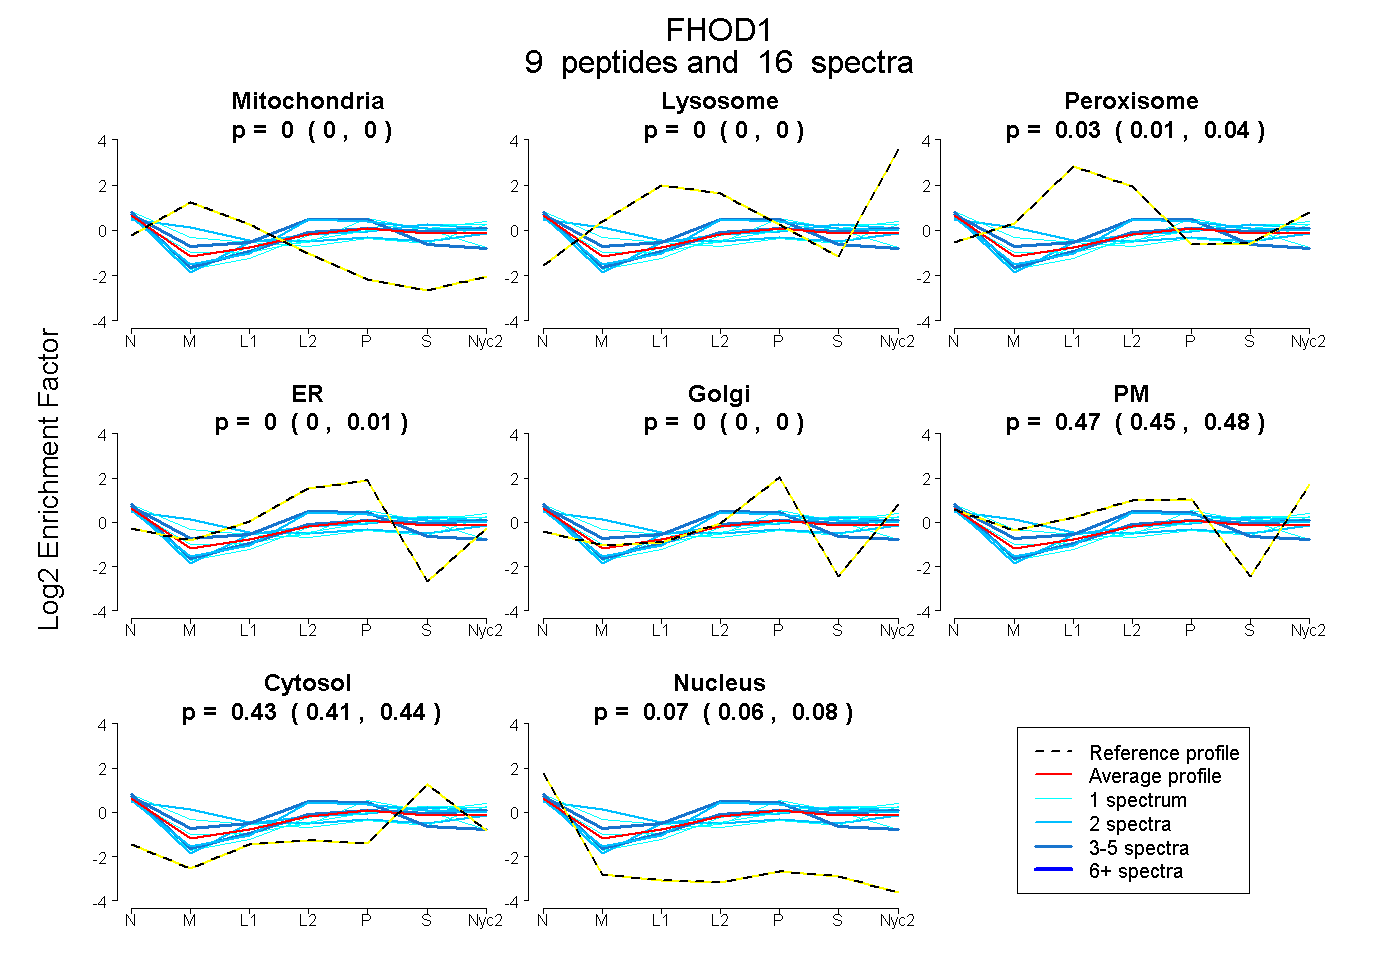
| Plot | Mito | Lyso | Perox | ER | Golgi | PM | Cytosol | Nucleus | |||||
| Expt A |
9 peptides |
16 spectra |
|
0.000 0.000 | 0.000 |
0.000 0.000 | 0.000 |
0.027 0.009 | 0.043 |
0.000 0.000 | 0.010 |
0.000 0.000 | 0.000 |
0.471 0.450 | 0.484 |
0.428 0.413 | 0.442 |
0.073 0.062 | 0.081 |
| 2 spectra, SQAAEDSLR | 0.000 | 0.000 | 0.000 | 0.144 | 0.000 | 0.373 | 0.481 | 0.002 | ||
| 3 spectra, LQLWAFK | 0.000 | 0.000 | 0.000 | 0.000 | 0.000 | 0.478 | 0.457 | 0.065 | ||
| 1 spectrum, KPTLILR | 0.000 | 0.000 | 0.000 | 0.000 | 0.000 | 0.429 | 0.542 | 0.029 | ||
| 2 spectra, LEHLFESR | 0.000 | 0.000 | 0.027 | 0.000 | 0.000 | 0.420 | 0.522 | 0.031 | ||
| 1 spectrum, LEDGDMEEAAAAAAAGGR | 0.157 | 0.000 | 0.000 | 0.000 | 0.000 | 0.478 | 0.313 | 0.052 | ||
| 1 spectrum, LLGAPLK | 0.000 | 0.000 | 0.000 | 0.000 | 0.000 | 0.485 | 0.483 | 0.031 | ||
| 1 spectrum, ELKPTGSPGCSR | 0.000 | 0.000 | 0.000 | 0.238 | 0.016 | 0.180 | 0.474 | 0.093 | ||
| 2 spectra, EFALEYR | 0.274 | 0.000 | 0.010 | 0.000 | 0.000 | 0.401 | 0.315 | 0.000 | ||
| 3 spectra, LTHFLAQCTR | 0.000 | 0.000 | 0.155 | 0.363 | 0.000 | 0.124 | 0.227 | 0.131 |
| Plot | Mito | Lyso or Perox | ER | Golgi | PM | Cytosol | Nucleus | ||||||
| Expt B |
1 peptide |
1 spectrum |
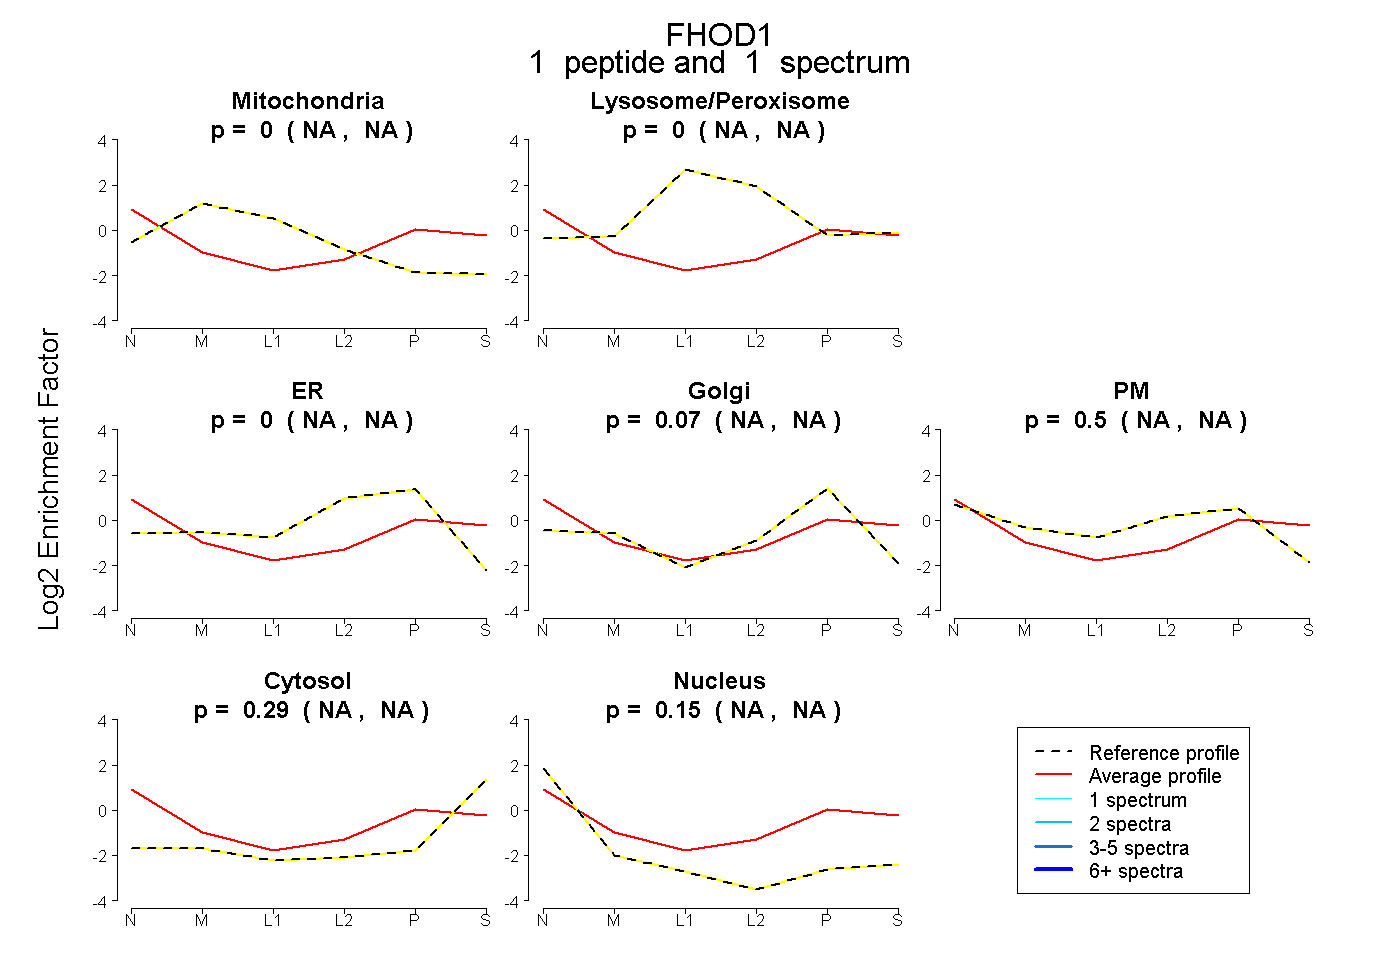 |
0.000 NA | NA |
0.000 NA | NA |
0.000 NA | NA |
0.067 NA | NA |
0.496 NA | NA |
0.291 NA | NA |
0.146 NA | NA |
|||
| Plot | Lyso | Other | |||||||||||
| Expt C |
5 peptides |
7 spectra |
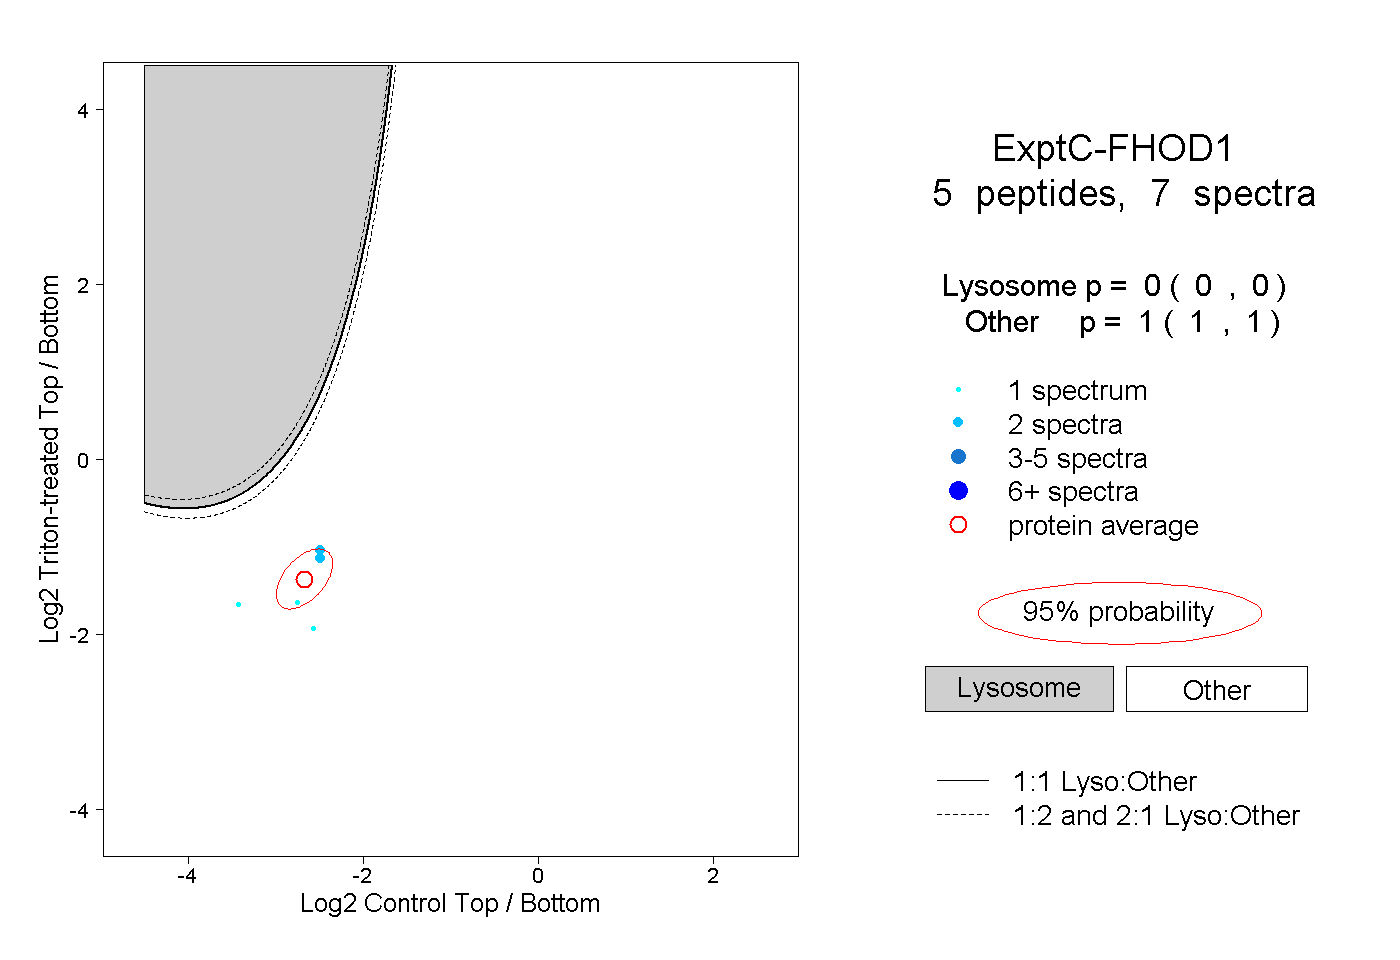 |
0.000 0.000 | 0.000 |
1.000 1.000 | 1.000 |
||||||||
| Plot | Lyso | Other | |||||||||||
| Expt D |
1 peptide |
1 spectrum |
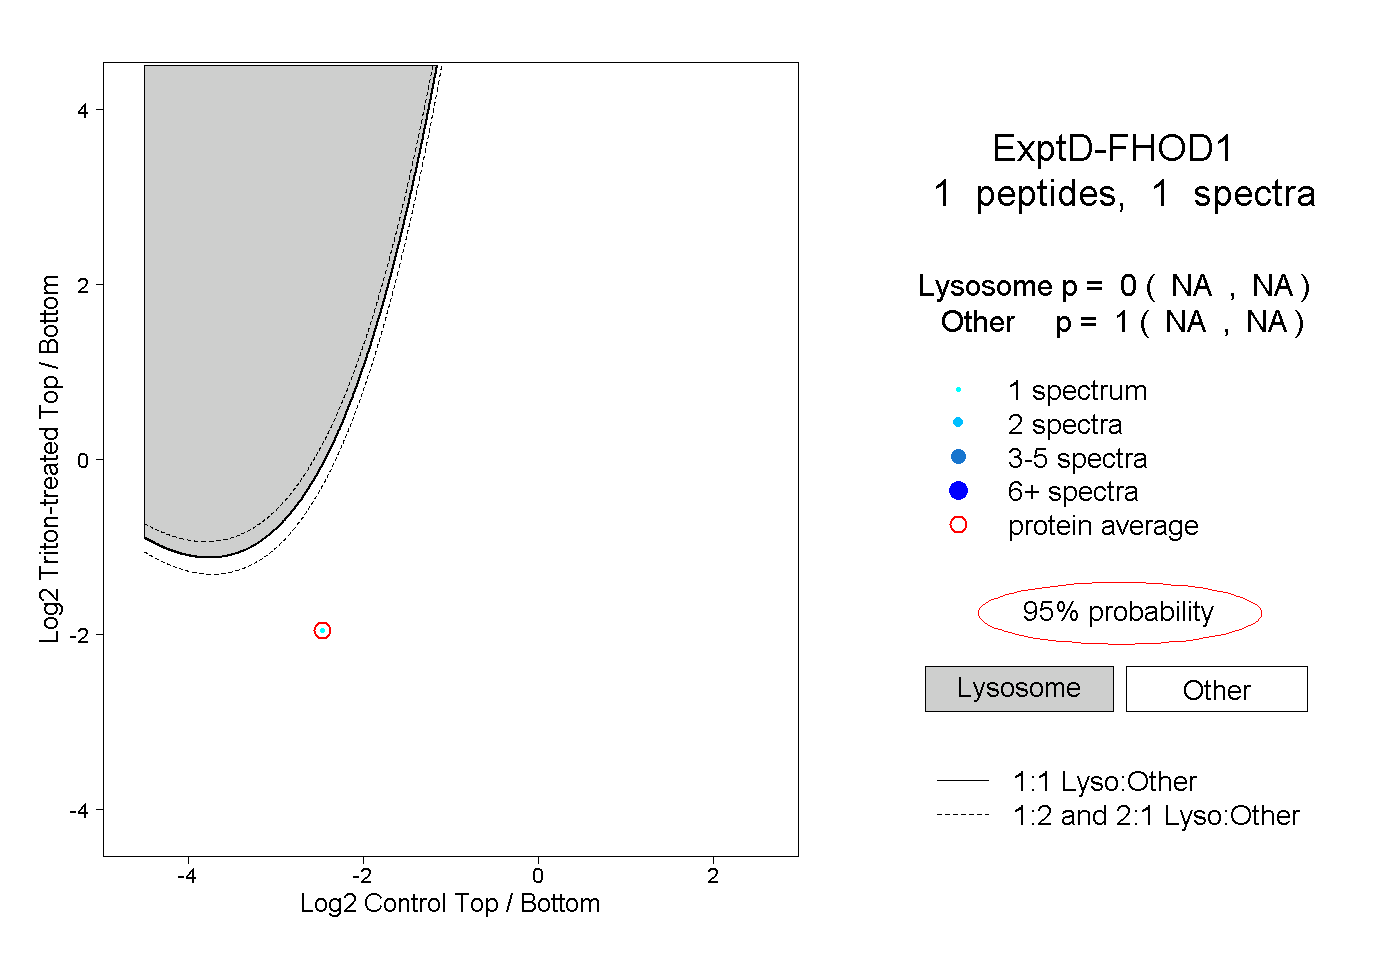 |
0.000 NA | NA |
1.000 NA | NA |