 8
8peptides
spectra
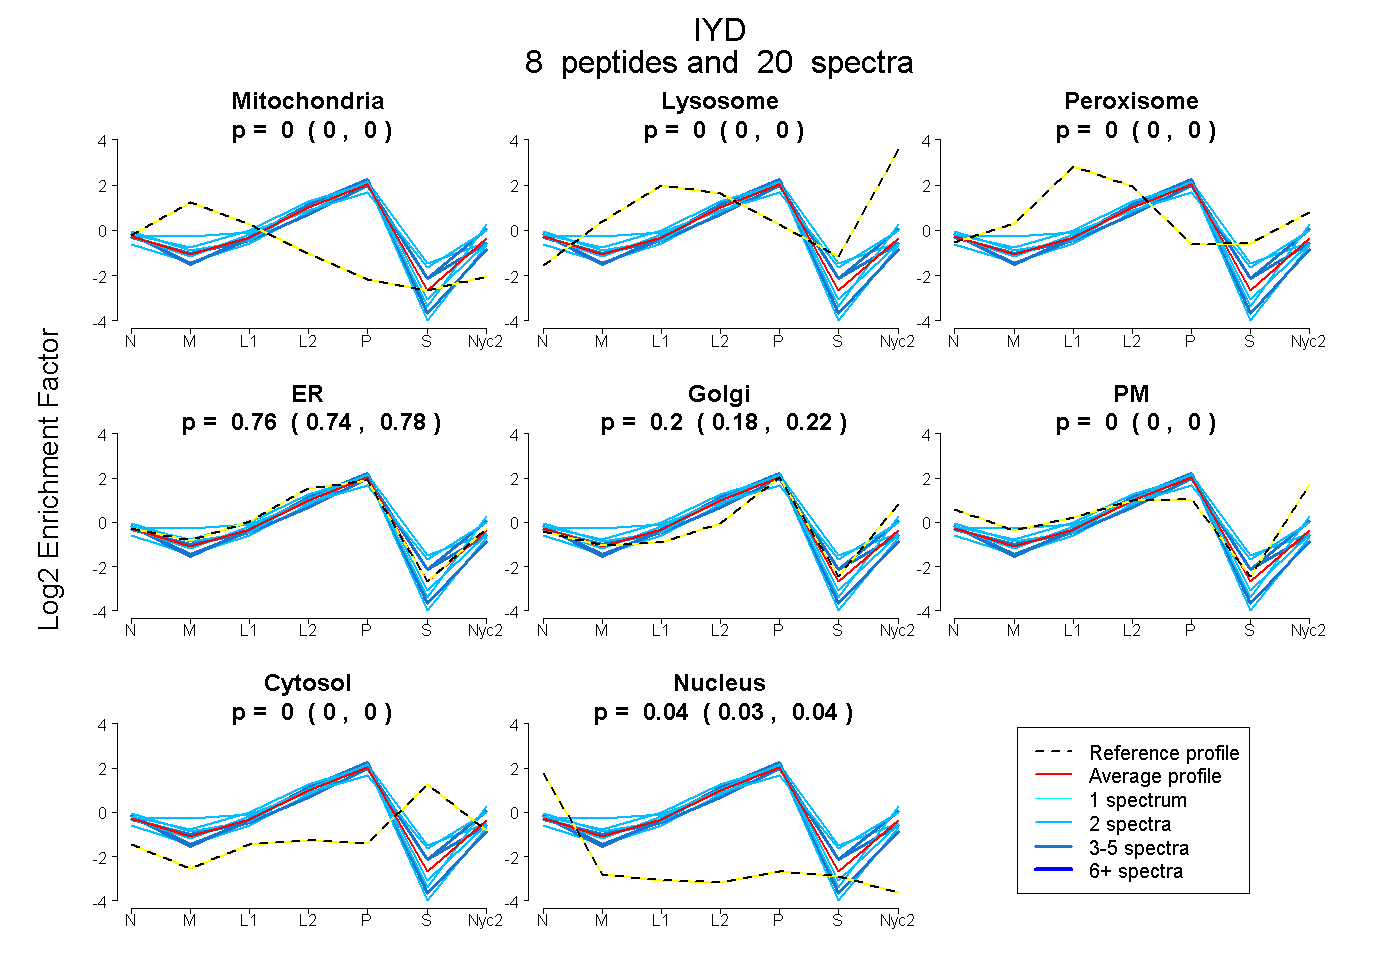
0.000 | 0.000
0.000 | 0.000
0.000 | 0.000
0.736 | 0.777
0.180 | 0.224
0.000 | 0.000
0.000 | 0.000
0.031 | 0.043
3peptides
spectra
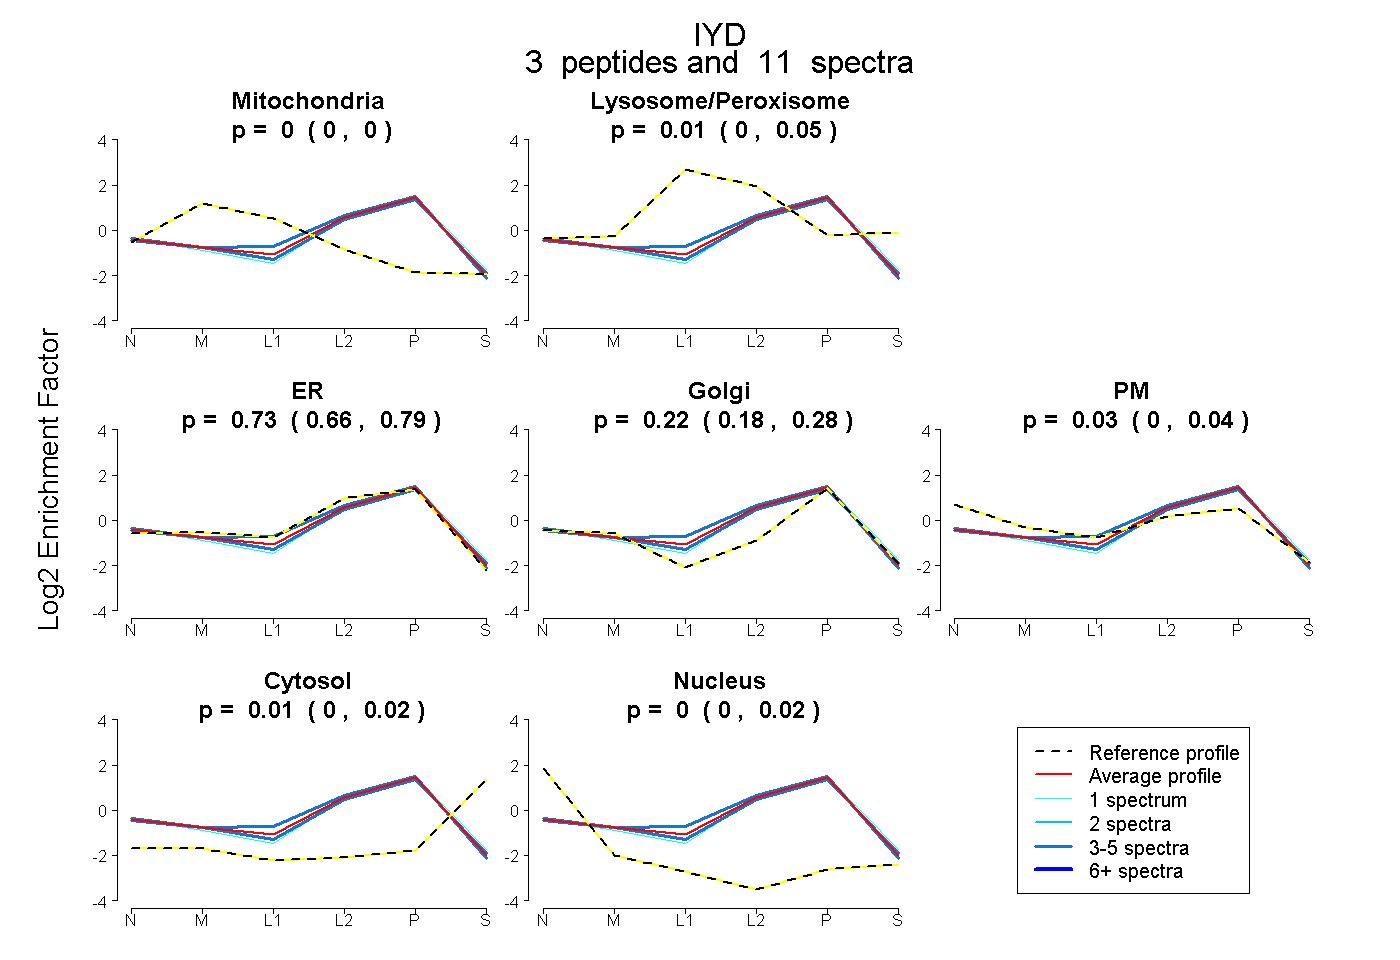
0.000 | 0.000
0.000 | 0.047
0.655 | 0.787
0.179 | 0.278
0.000 | 0.042
0.000 | 0.024
0.000 | 0.018
7peptides
spectra
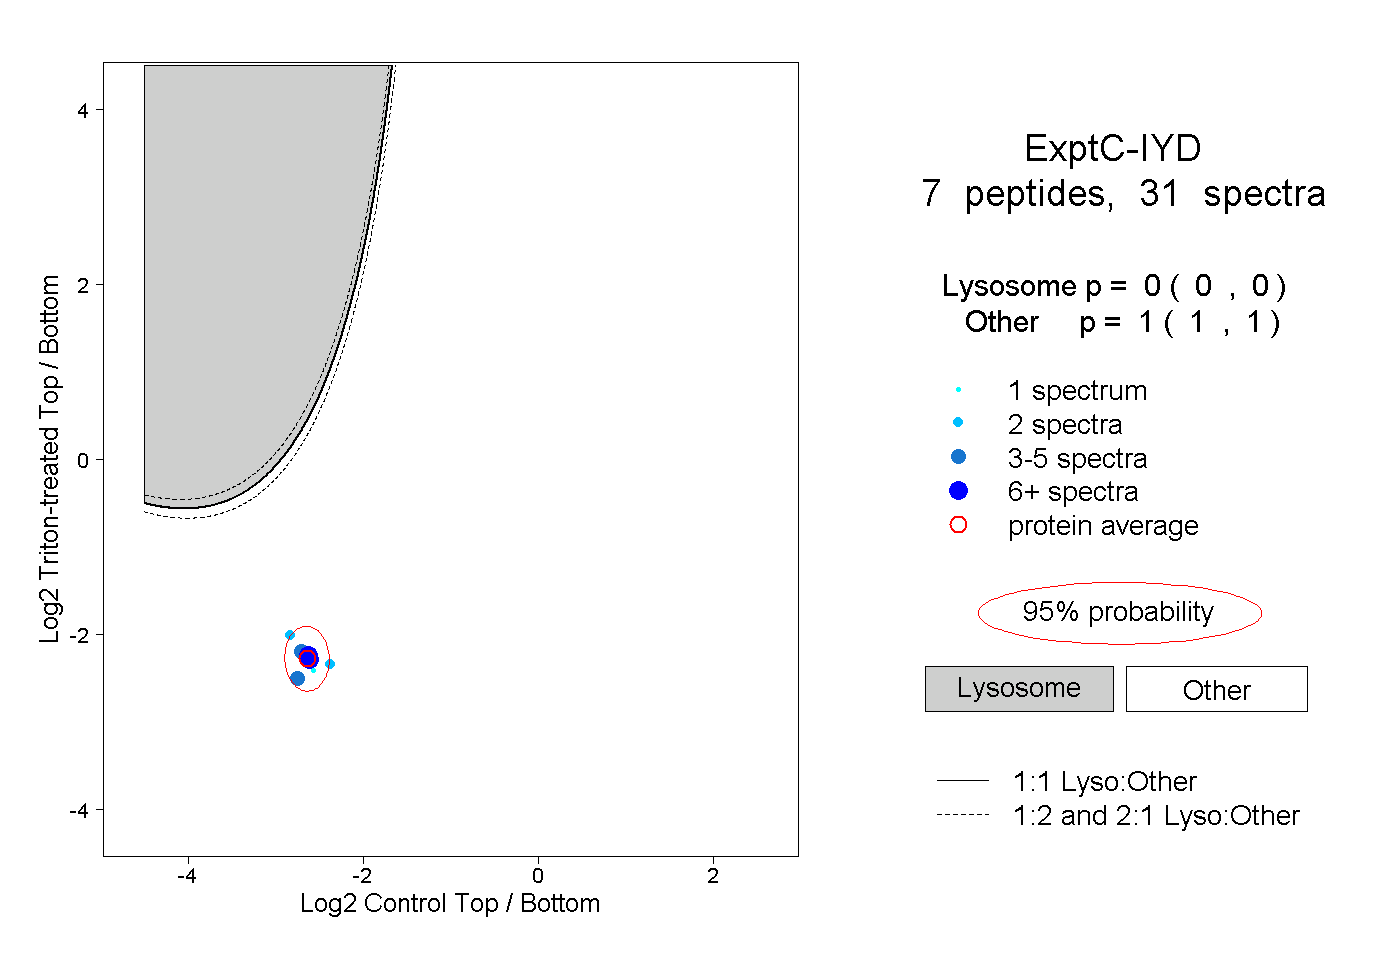
0.000 | 0.000
1.000 | 1.000
1peptide
spectrum

NA | NA
NA | NA