 8
8peptides
spectra
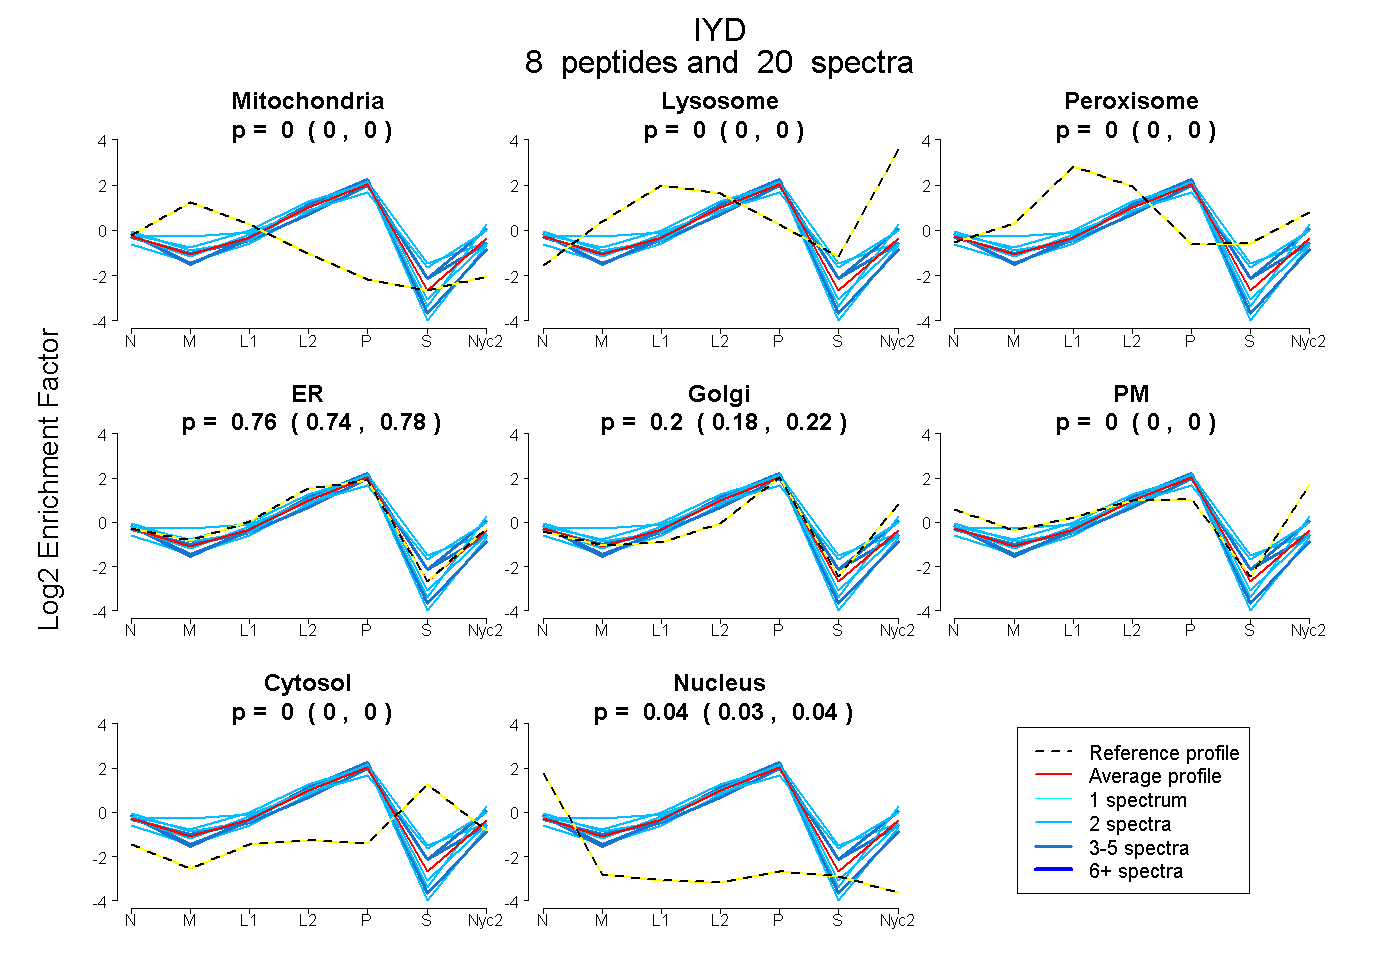
0.000 | 0.000
0.000 | 0.000
0.000 | 0.000
0.736 | 0.777
0.180 | 0.224
0.000 | 0.000
0.000 | 0.000
0.031 | 0.043
| Plot | Mito | Lyso | Perox | ER | Golgi | PM | Cytosol | Nucleus | |||||
| Expt A |
8 peptides |
20 spectra |
|
0.000 0.000 | 0.000 |
0.000 0.000 | 0.000 |
0.000 0.000 | 0.000 |
0.759 0.736 | 0.777 |
0.203 0.180 | 0.224 |
0.000 0.000 | 0.000 |
0.000 0.000 | 0.000 |
0.038 0.031 | 0.043 |
| 2 spectra, SQEFYELLSK | 0.000 | 0.000 | 0.000 | 0.928 | 0.000 | 0.000 | 0.000 | 0.072 | ||
| 2 spectra, AQPWVDEDLK | 0.000 | 0.000 | 0.000 | 0.631 | 0.192 | 0.000 | 0.177 | 0.000 | ||
| 2 spectra, QVHGFAVNGK | 0.021 | 0.000 | 0.140 | 0.472 | 0.317 | 0.000 | 0.050 | 0.000 | ||
| 2 spectra, YPEQEMR | 0.000 | 0.000 | 0.000 | 0.854 | 0.103 | 0.000 | 0.000 | 0.043 | ||
| 4 spectra, GATVPDLK | 0.000 | 0.000 | 0.000 | 0.521 | 0.414 | 0.000 | 0.065 | 0.000 | ||
| 3 spectra, FISSEPVPMEVIDNVIK | 0.000 | 0.000 | 0.000 | 0.820 | 0.070 | 0.000 | 0.081 | 0.028 | ||
| 3 spectra, VLLGRPSHEK | 0.000 | 0.000 | 0.000 | 0.924 | 0.000 | 0.000 | 0.000 | 0.076 | ||
| 2 spectra, WVTDLK | 0.000 | 0.000 | 0.000 | 0.755 | 0.123 | 0.121 | 0.000 | 0.000 |
| Plot | Mito | Lyso or Perox | ER | Golgi | PM | Cytosol | Nucleus | ||||||
| Expt B |
3 peptides |
11 spectra |
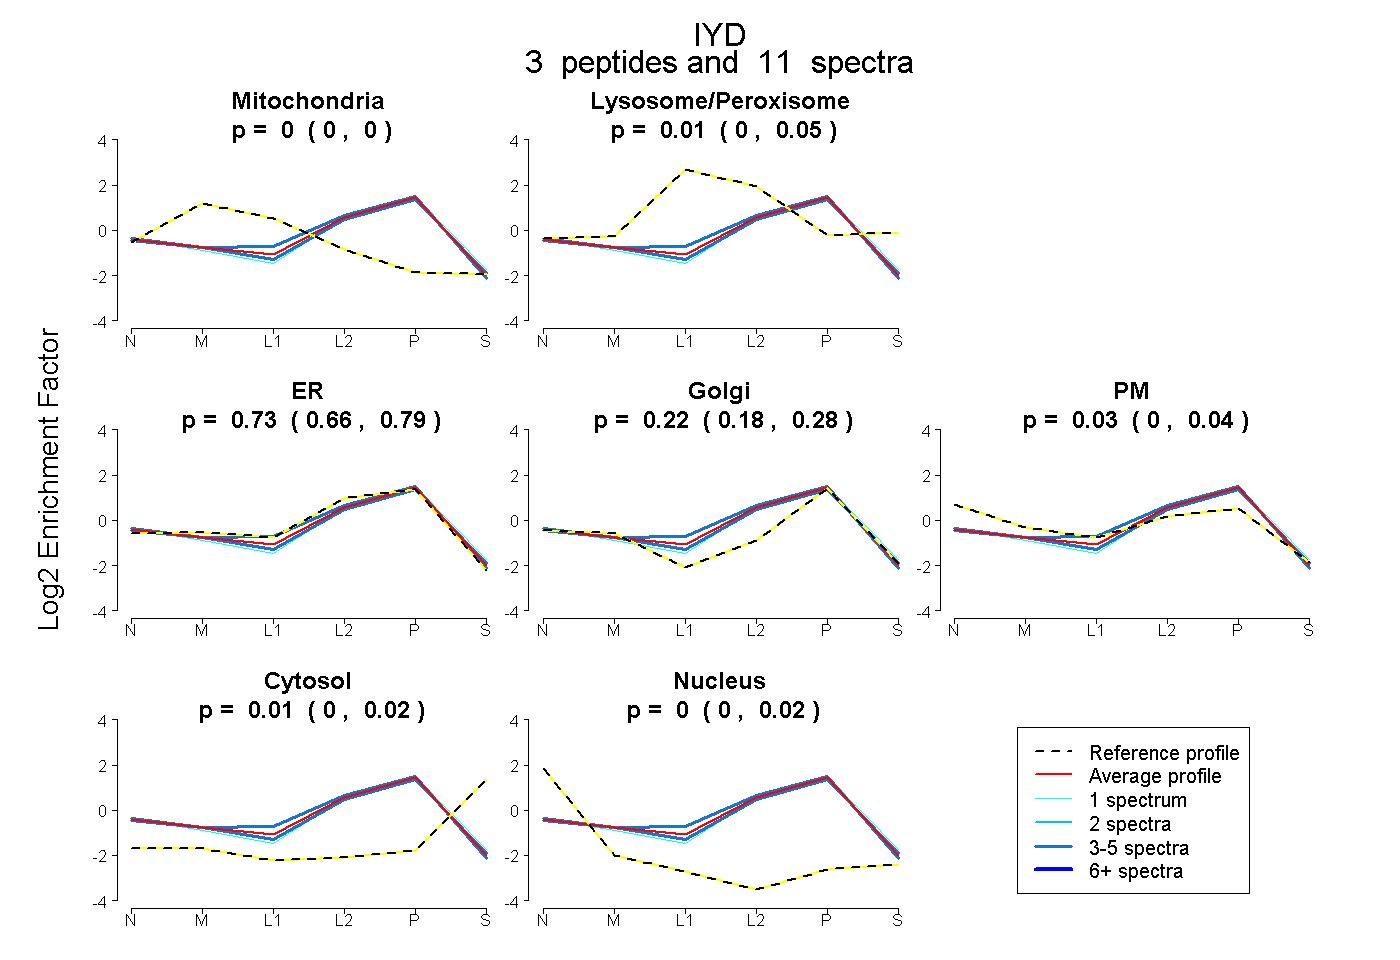 |
0.000 0.000 | 0.000 |
0.006 0.000 | 0.047 |
0.730 0.655 | 0.787 |
0.223 0.179 | 0.278 |
0.033 0.000 | 0.042 |
0.009 0.000 | 0.024 |
0.000 0.000 | 0.018 |
|||
| Plot | Lyso | Other | |||||||||||
| Expt C |
7 peptides |
31 spectra |
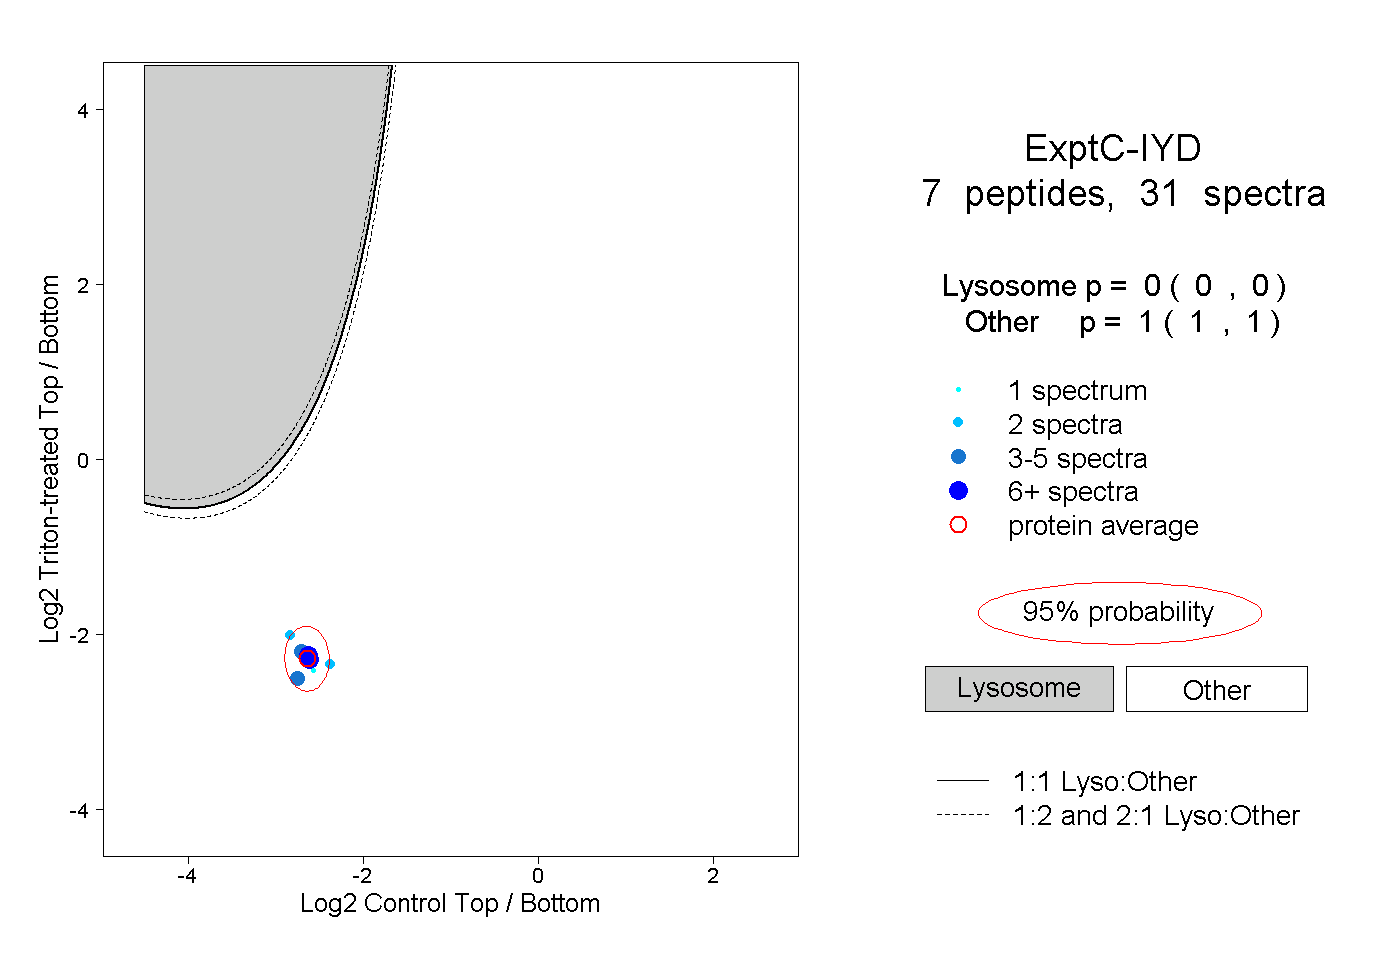 |
0.000 0.000 | 0.000 |
1.000 1.000 | 1.000 |
||||||||
| Plot | Lyso | Other | |||||||||||
| Expt D |
1 peptide |
1 spectrum |
 |
0.000 NA | NA |
1.000 NA | NA |