 8
8peptides
spectra
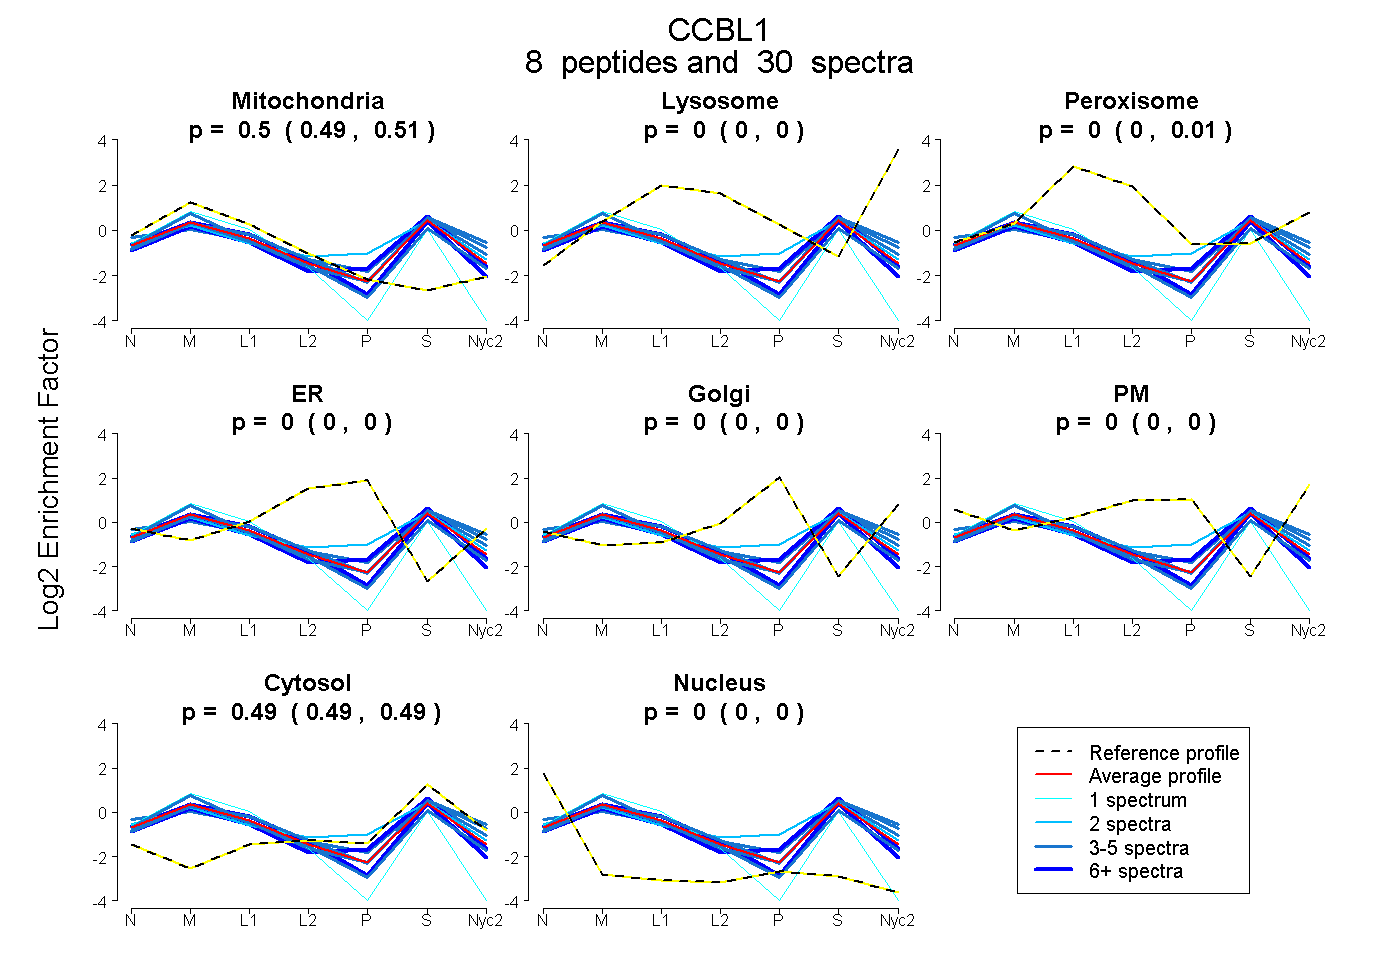
0.494 | 0.512
0.000 | 0.000
0.000 | 0.013
0.000 | 0.000
0.000 | 0.000
0.000 | 0.000
0.485 | 0.495
0.000 | 0.000
3peptides
spectra
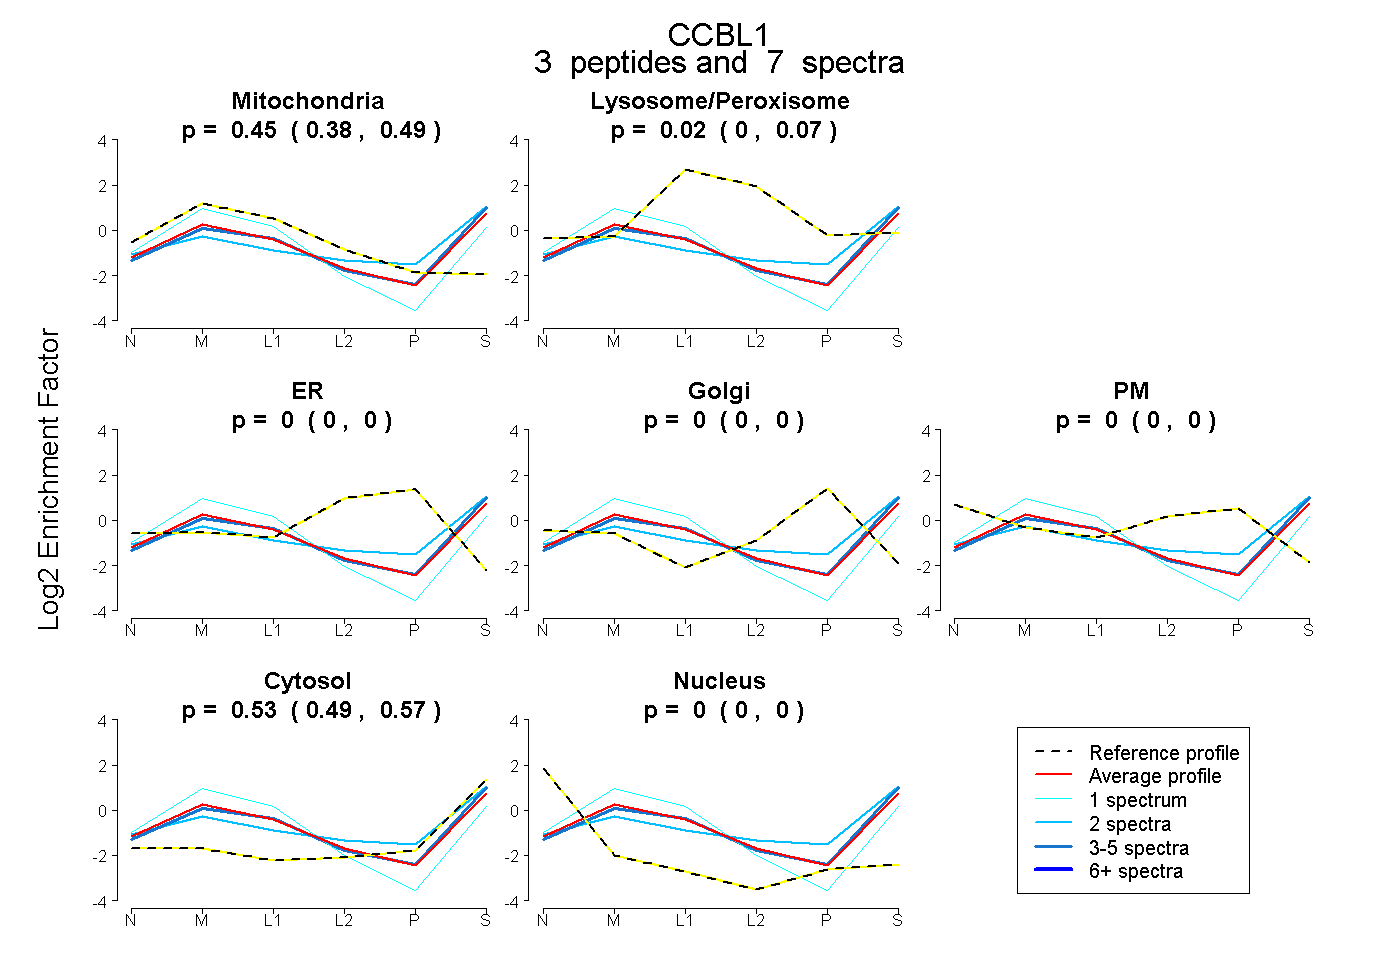
0.379 | 0.491
0.000 | 0.065
0.000 | 0.000
0.000 | 0.000
0.000 | 0.000
0.494 | 0.566
0.000 | 0.000
9peptides
spectra
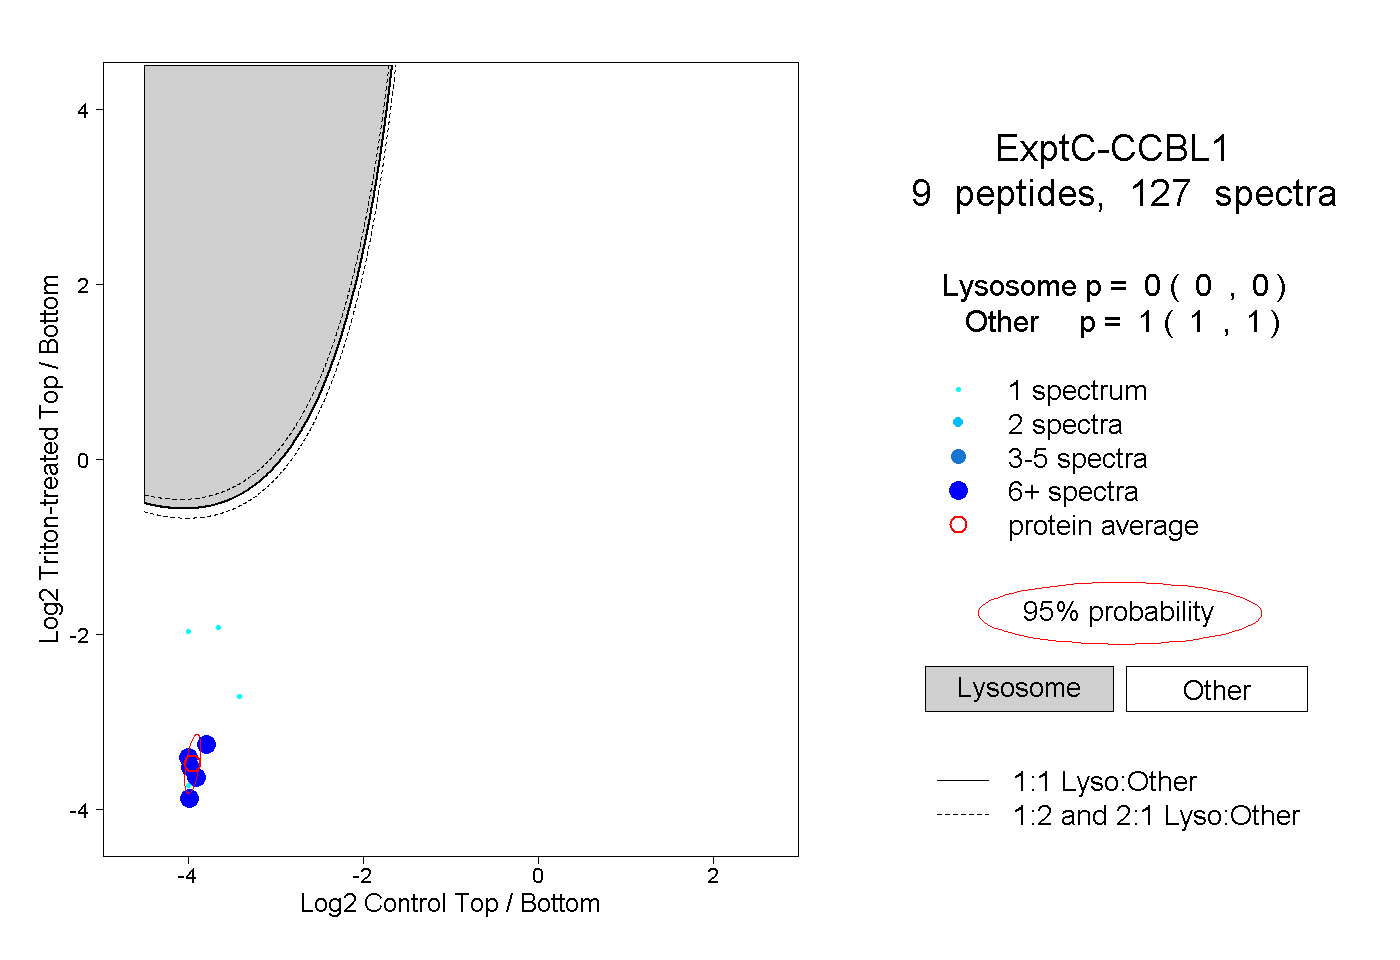
0.000 | 0.000
1.000 | 1.000
4peptides
spectra
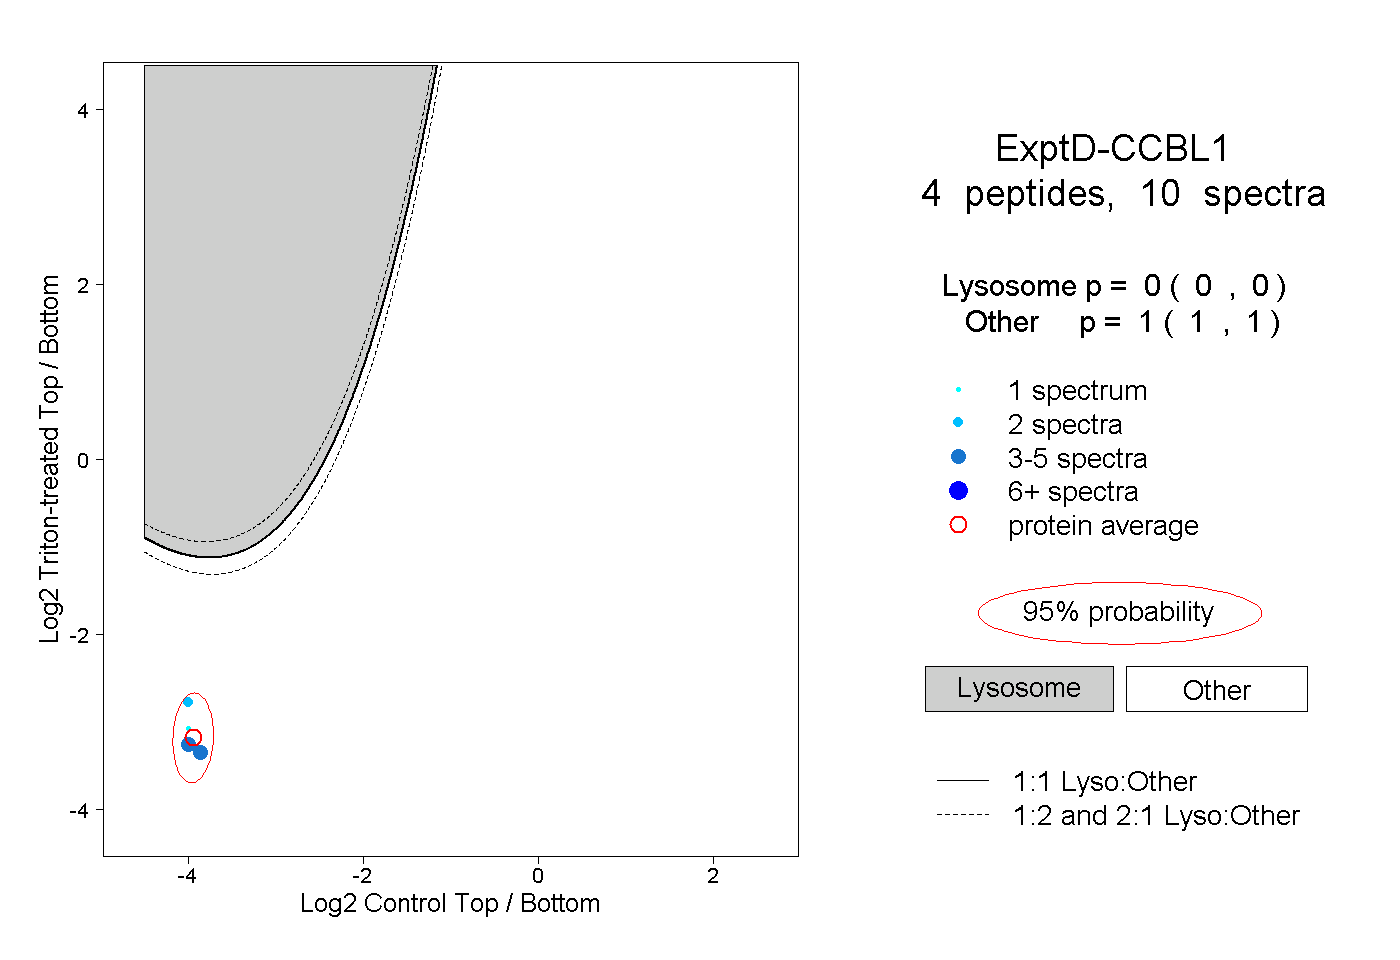
0.000 | 0.000
1.000 | 1.000