 8
8peptides
spectra
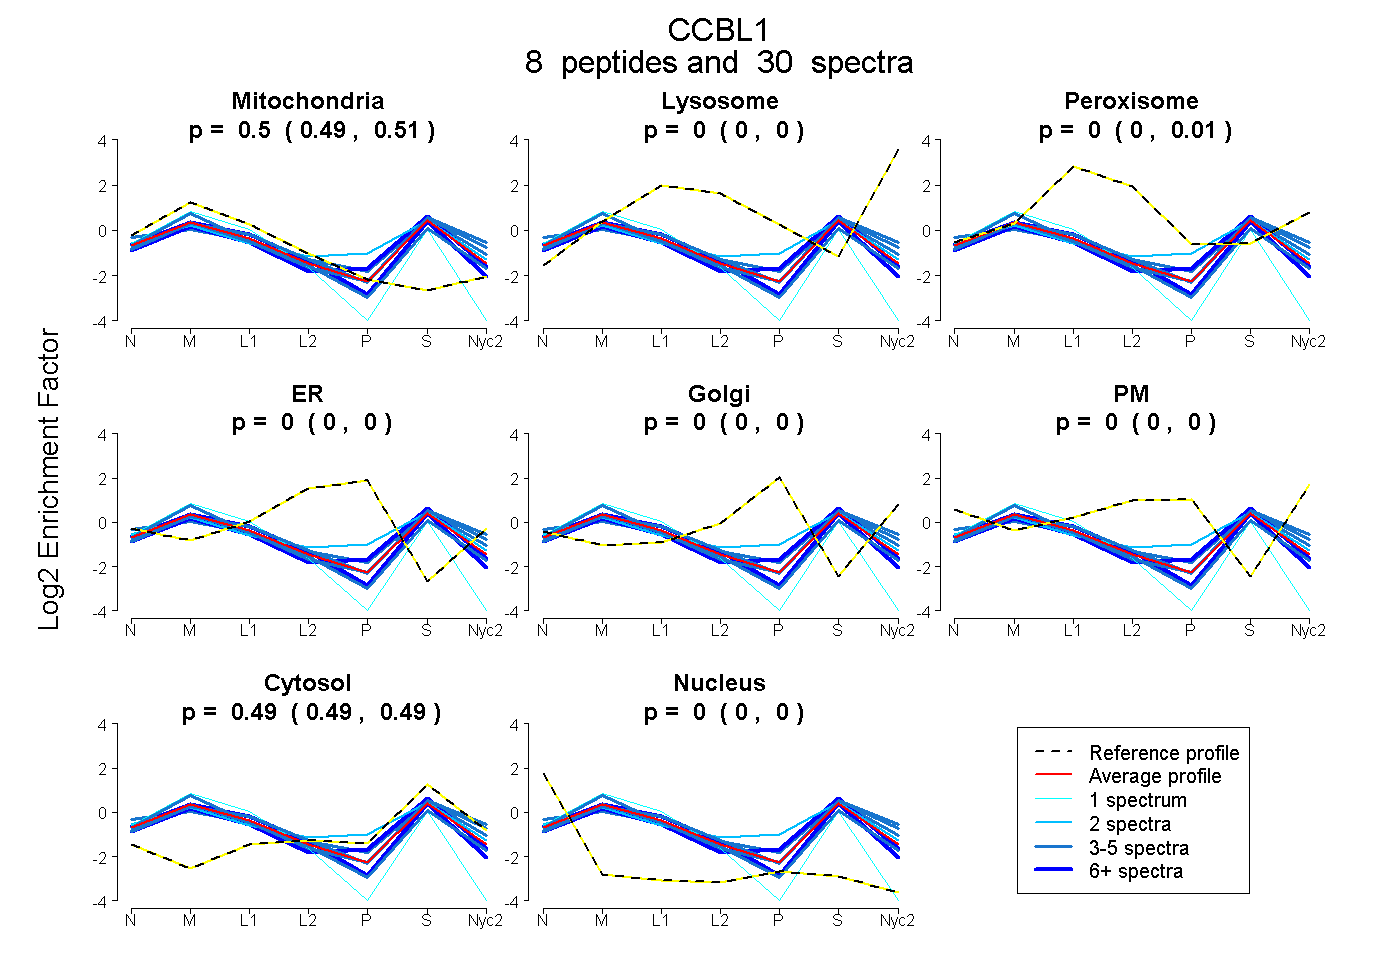
0.494 | 0.512
0.000 | 0.000
0.000 | 0.013
0.000 | 0.000
0.000 | 0.000
0.000 | 0.000
0.485 | 0.495
0.000 | 0.000
| Plot | Mito | Lyso | Perox | ER | Golgi | PM | Cytosol | Nucleus | |||||
| Expt A |
8 peptides |
30 spectra |
|
0.505 0.494 | 0.512 |
0.000 0.000 | 0.000 |
0.004 0.000 | 0.013 |
0.000 0.000 | 0.000 |
0.000 0.000 | 0.000 |
0.000 0.000 | 0.000 |
0.491 0.485 | 0.495 |
0.000 0.000 | 0.000 |
| 6 spectra, DFDHYIR | 0.445 | 0.000 | 0.000 | 0.000 | 0.000 | 0.000 | 0.555 | 0.000 | ||
| 4 spectra, ATLQAMDER | 0.404 | 0.000 | 0.076 | 0.000 | 0.000 | 0.000 | 0.521 | 0.000 | ||
| 4 spectra, TLTIGSAGK | 0.605 | 0.000 | 0.000 | 0.000 | 0.000 | 0.000 | 0.395 | 0.000 | ||
| 6 spectra, ILVLNTPNNPLGK | 0.554 | 0.000 | 0.000 | 0.000 | 0.000 | 0.000 | 0.446 | 0.000 | ||
| 3 spectra, SFSATGWK | 0.415 | 0.064 | 0.000 | 0.000 | 0.000 | 0.000 | 0.521 | 0.000 | ||
| 2 spectra, LGASNDWQLDPAELASK | 0.387 | 0.000 | 0.093 | 0.000 | 0.004 | 0.000 | 0.515 | 0.000 | ||
| 1 spectrum, SLQSVGLK | 0.708 | 0.000 | 0.000 | 0.000 | 0.000 | 0.000 | 0.221 | 0.071 | ||
| 4 spectra, VGWVMGPDNIMK | 0.393 | 0.000 | 0.113 | 0.000 | 0.000 | 0.000 | 0.495 | 0.000 |
| Plot | Mito | Lyso or Perox | ER | Golgi | PM | Cytosol | Nucleus | ||||||
| Expt B |
3 peptides |
7 spectra |
 |
0.446 0.379 | 0.491 |
0.021 0.000 | 0.065 |
0.000 0.000 | 0.000 |
0.000 0.000 | 0.000 |
0.000 0.000 | 0.000 |
0.533 0.494 | 0.566 |
0.000 0.000 | 0.000 |
|||
| Plot | Lyso | Other | |||||||||||
| Expt C |
9 peptides |
127 spectra |
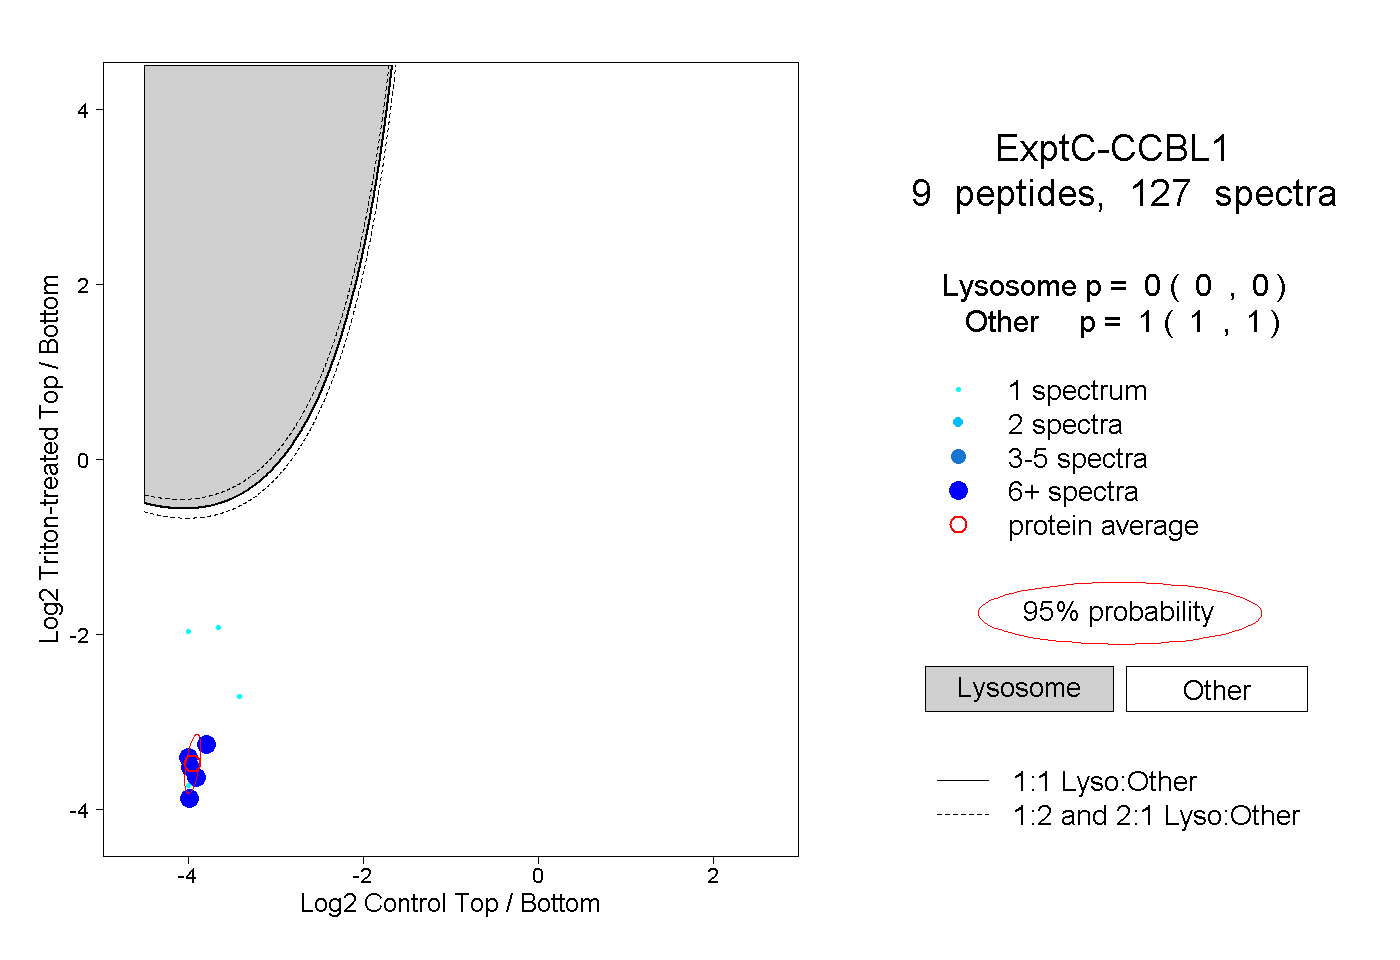 |
0.000 0.000 | 0.000 |
1.000 1.000 | 1.000 |
||||||||
| Plot | Lyso | Other | |||||||||||
| Expt D |
4 peptides |
10 spectra |
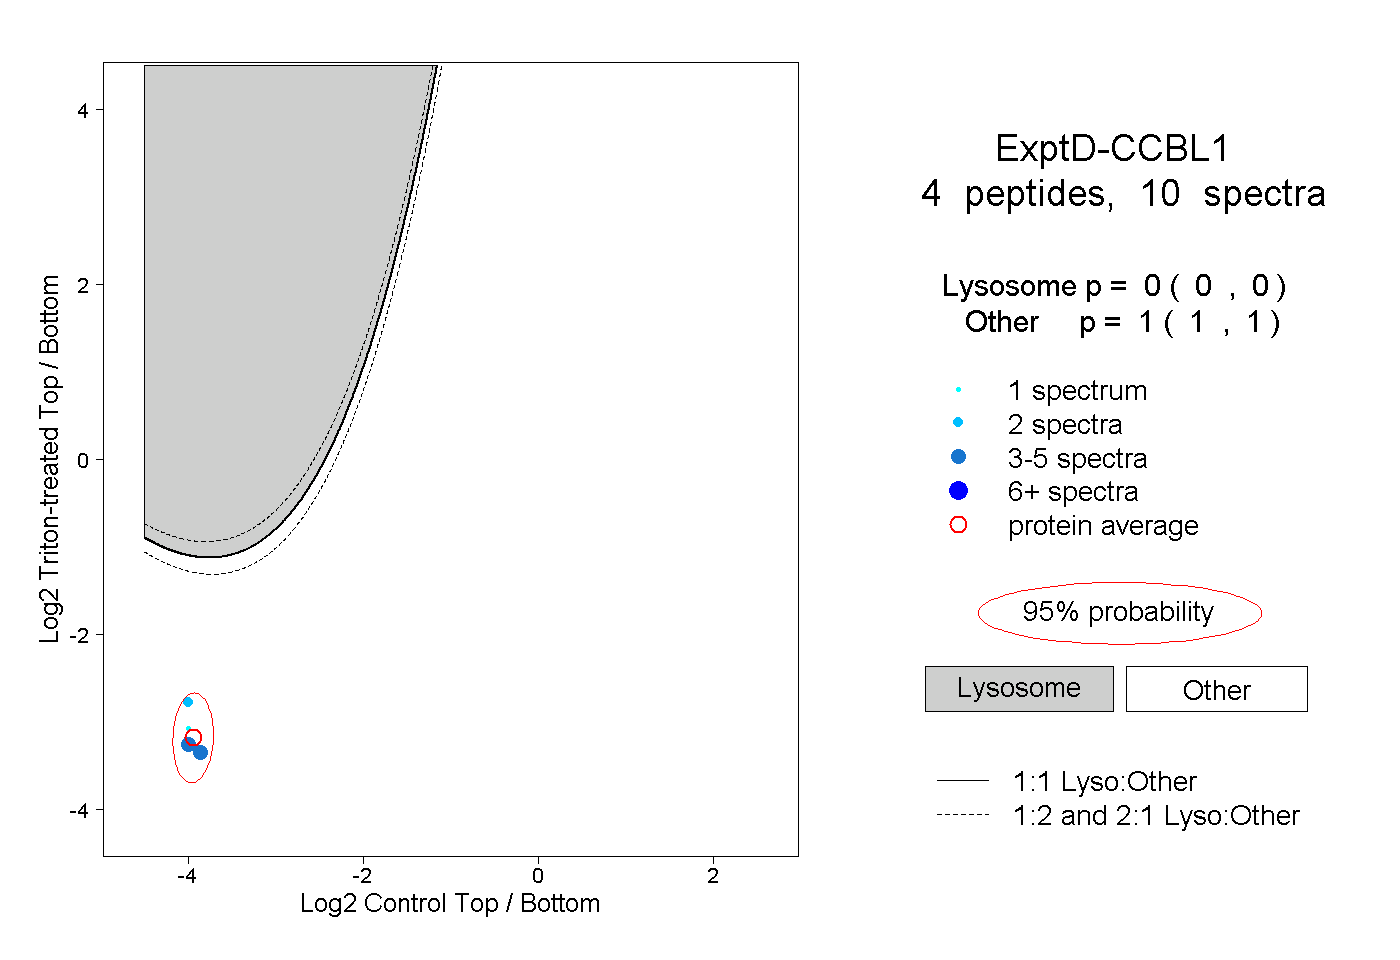 |
0.000 0.000 | 0.000 |
1.000 1.000 | 1.000 |