 38
38peptides
spectra
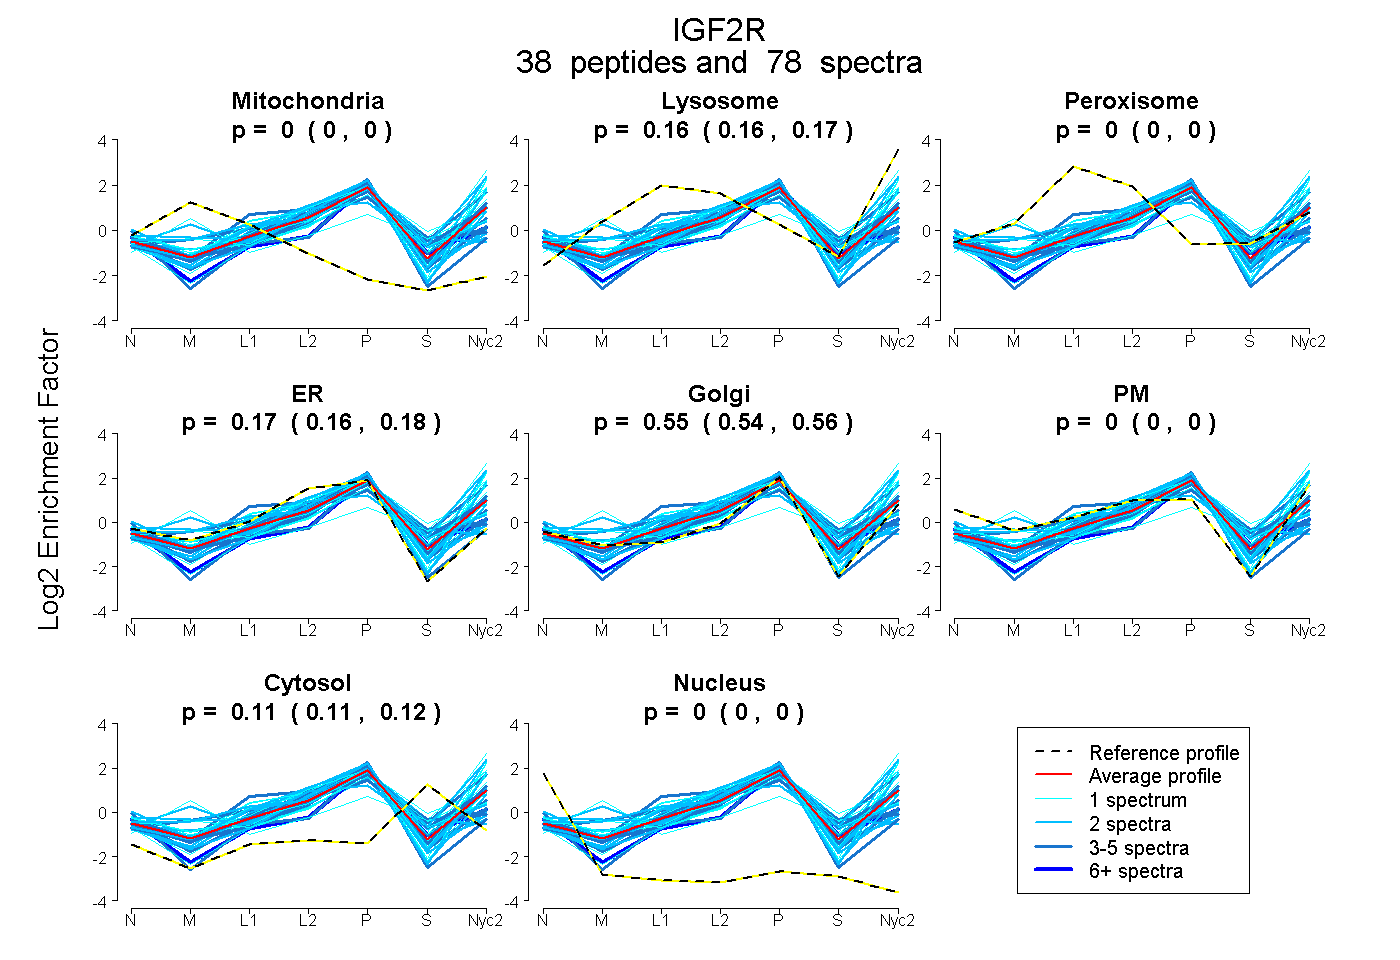
0.000 | 0.000
0.160 | 0.169
0.000 | 0.000
0.159 | 0.180
0.539 | 0.558
0.000 | 0.000
0.111 | 0.118
0.000 | 0.000
6peptides
spectra
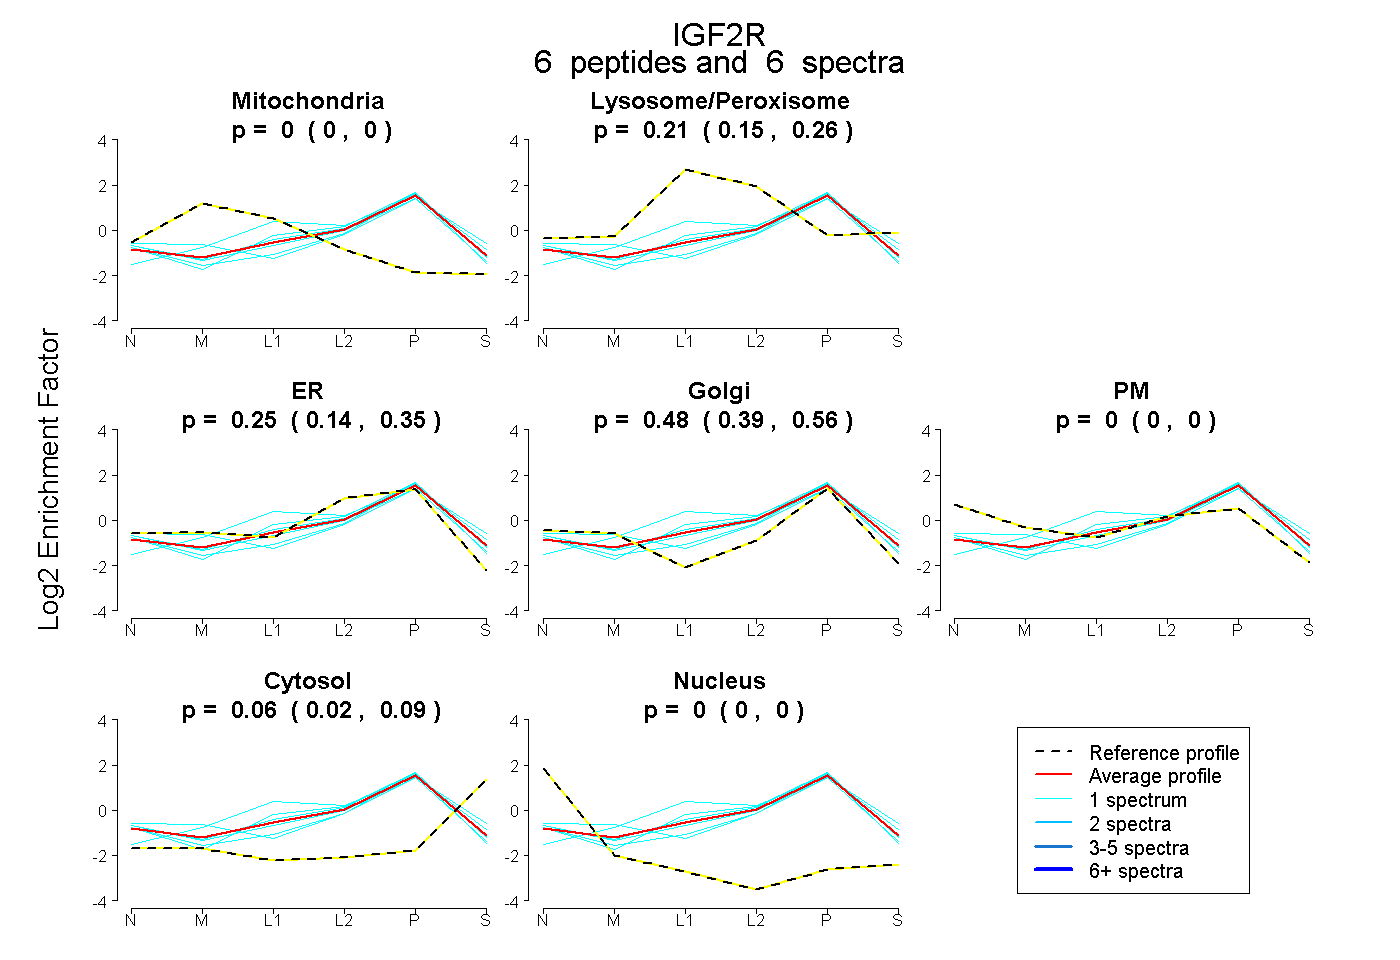
0.000 | 0.000
0.150 | 0.261
0.136 | 0.350
0.388 | 0.558
0.000 | 0.000
0.020 | 0.088
0.000 | 0.000
41peptides
spectra
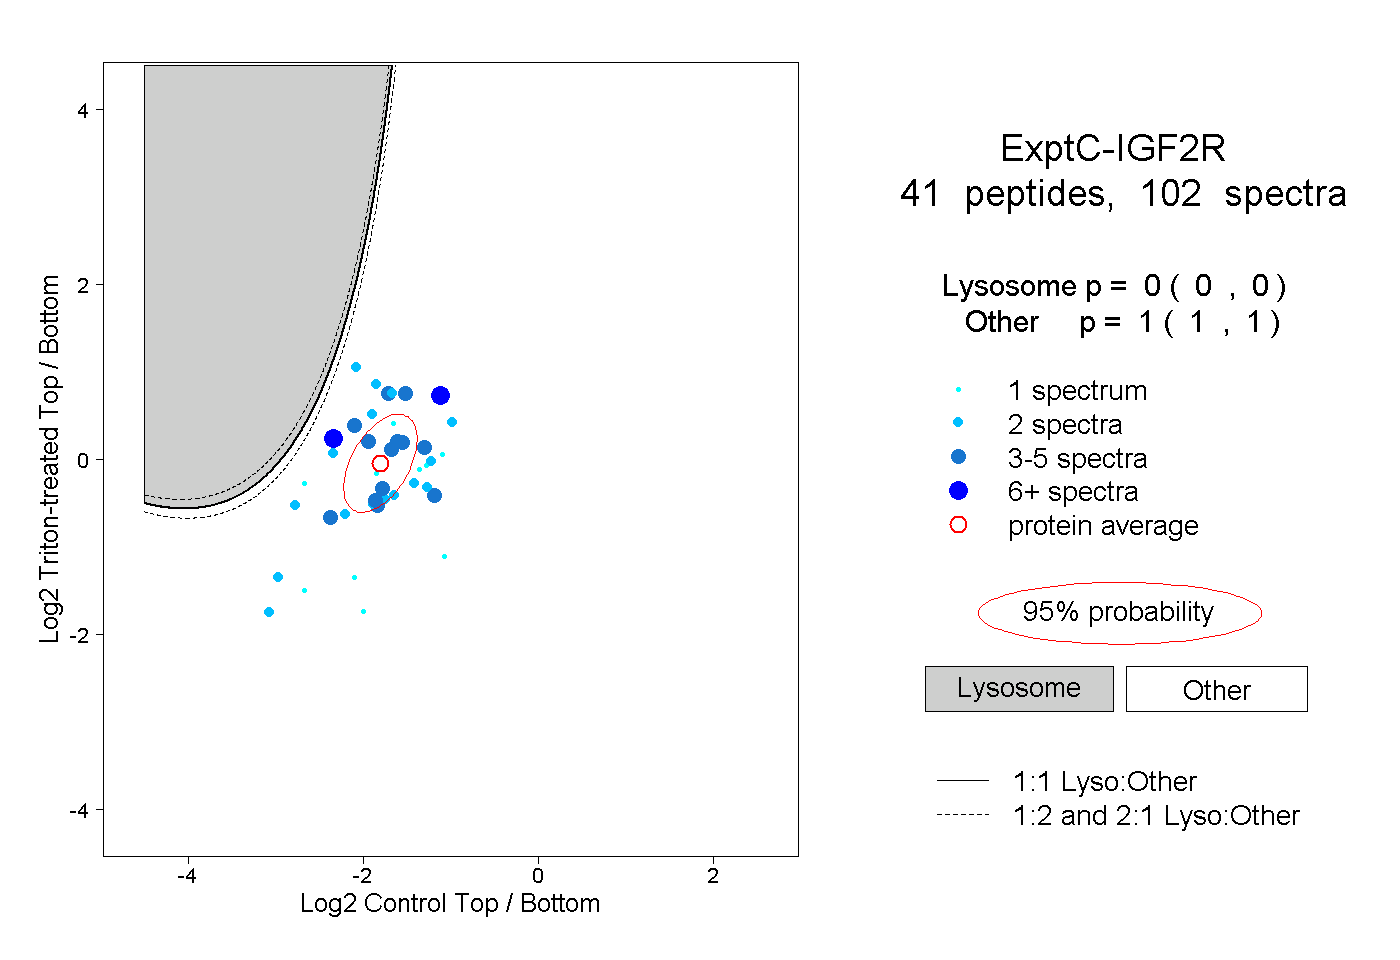
0.000 | 0.000
1.000 | 1.000
5peptides
spectra
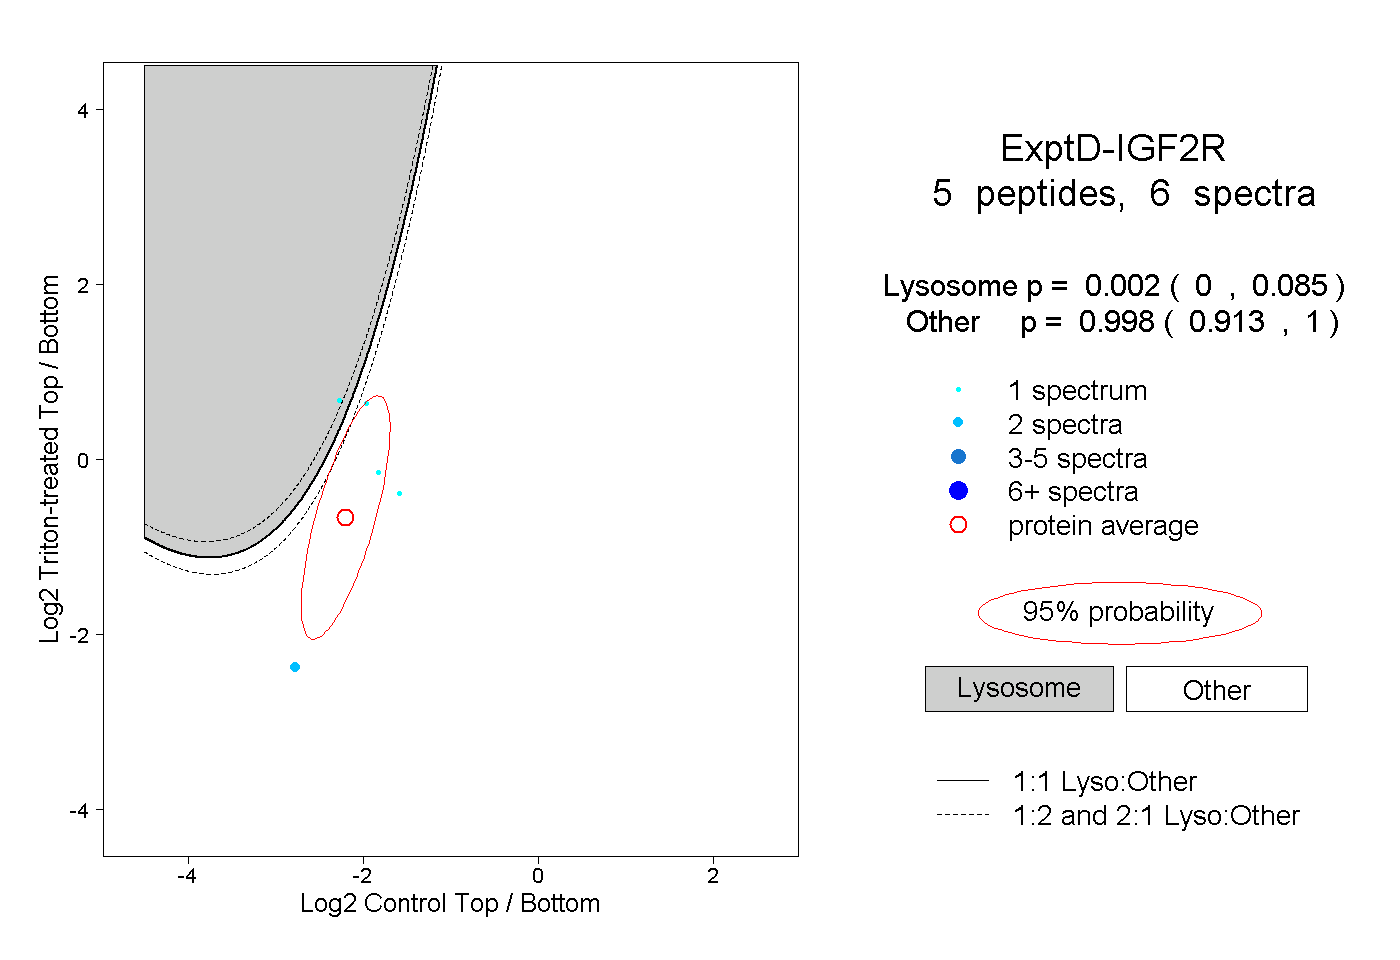
0.000 | 0.085
0.913 | 1.000