IGF2R
[ENSRNOP00000021840]
Main page
| | | Plot |
Mito |
Lyso |
|
Perox |
ER |
Golgi |
PM |
Cytosol |
Nucleus |
|
| Expt A |
 38
38
peptides |
78
spectra |
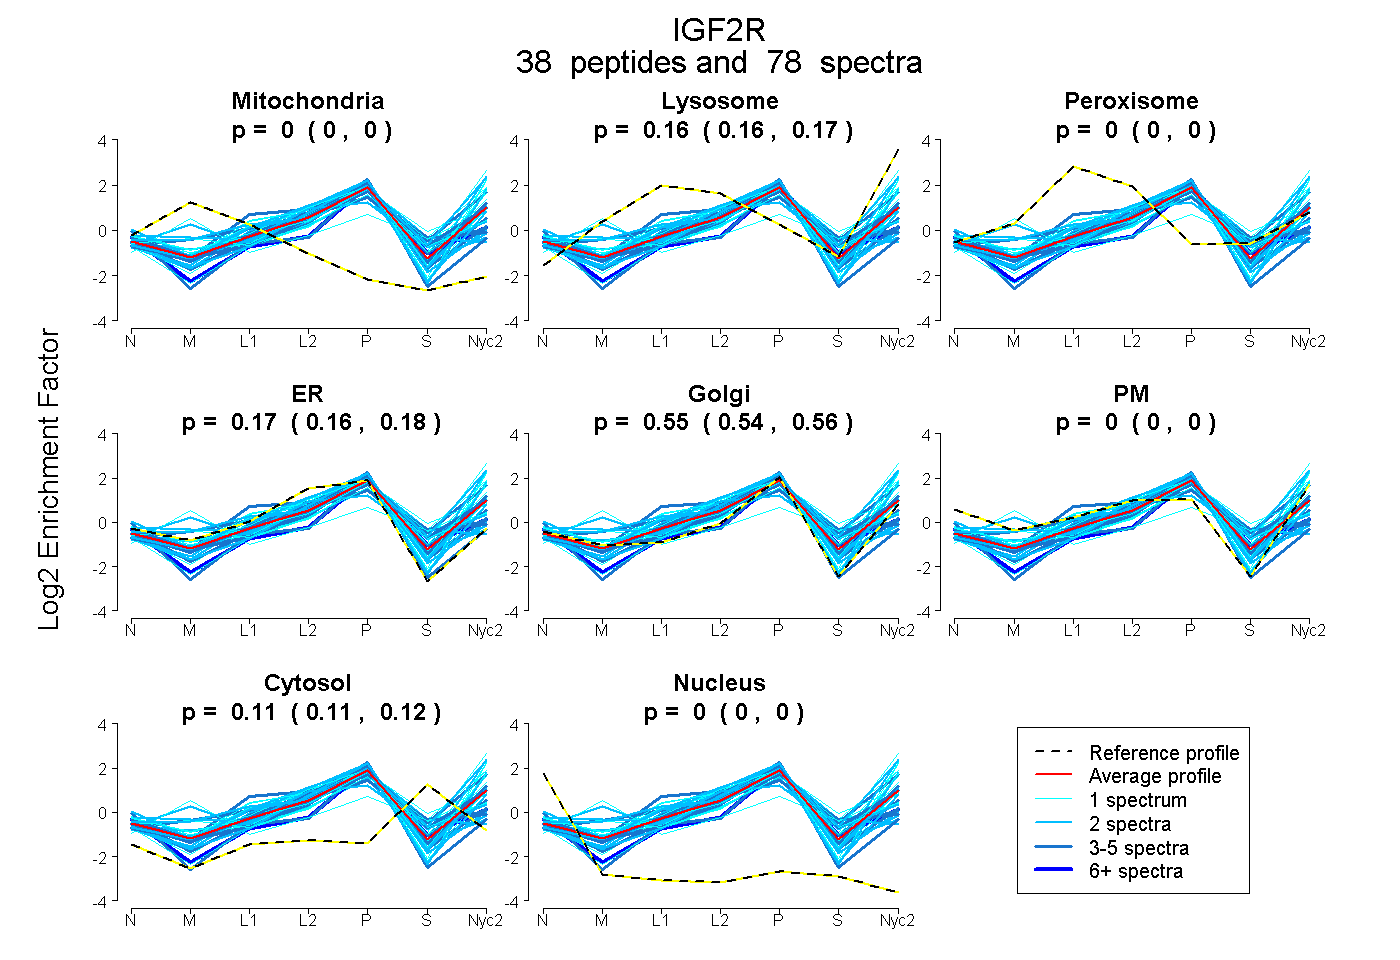 |
0.000
0.000 | 0.000 |
0.165
0.160 | 0.169 |
|
0.000
0.000 | 0.000 |
0.170
0.159 | 0.180 |
0.550
0.539 | 0.558 |
0.000
0.000 | 0.000 |
0.115
0.111 | 0.118 |
0.000
0.000 | 0.000 |
|
| | | Plot |
Mito |
|
Lyso or Perox |
|
ER |
Golgi |
PM |
Cytosol |
Nucleus |
|
| Expt B |
6
peptides |
6
spectra |
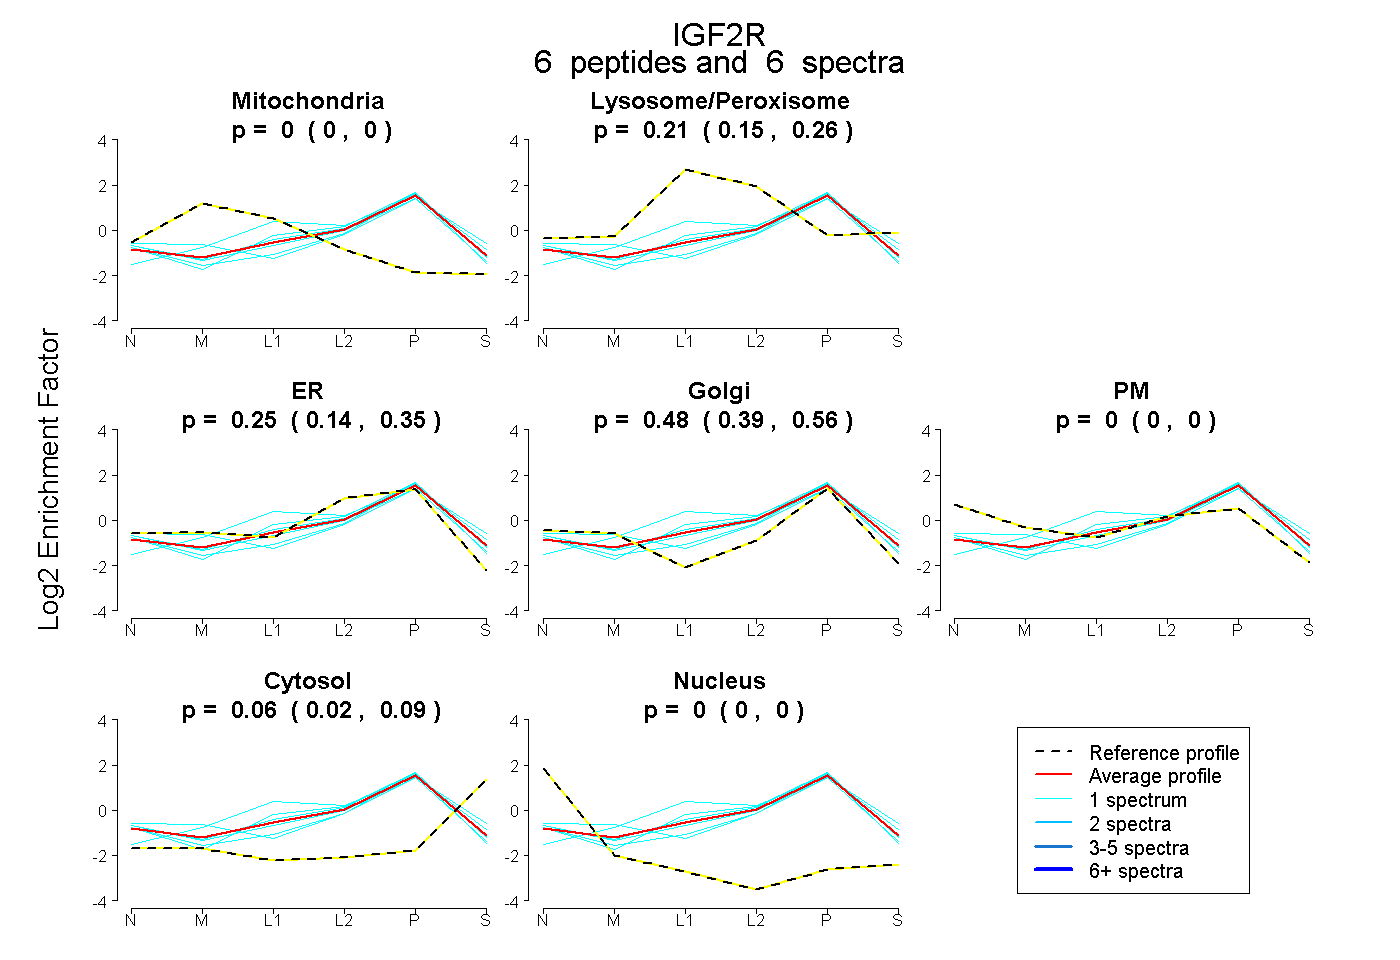 |
0.000
0.000 | 0.000 |
|
0.212
0.150 | 0.261 |
|
0.250
0.136 | 0.350 |
0.482
0.388 | 0.558 |
0.000
0.000 | 0.000 |
0.056
0.020 | 0.088 |
0.000
0.000 | 0.000 |
|
| 1 spectrum, TVEACPVVR |
0.000 |
|
0.220 |
|
0.355 |
0.372 |
0.000 |
0.052 |
0.000 |
|
| 1 spectrum, STLITFLCDR |
0.000 |
|
0.064 |
|
0.396 |
0.422 |
0.000 |
0.118 |
0.000 |
|
| 1 spectrum, GTAFIIR |
0.000 |
|
0.213 |
|
0.290 |
0.497 |
0.000 |
0.000 |
0.000 |
|
| 1 spectrum, LTTYSTR |
0.000 |
|
0.242 |
|
0.147 |
0.493 |
0.000 |
0.119 |
0.000 |
|
| 1 spectrum, SVGDSLLR |
0.000 |
|
0.141 |
|
0.149 |
0.694 |
0.000 |
0.016 |
0.000 |
|
| 1 spectrum, IHLVCGR |
0.000 |
|
0.380 |
|
0.191 |
0.385 |
0.000 |
0.043 |
0.000 |
|
| | | Plot |
|
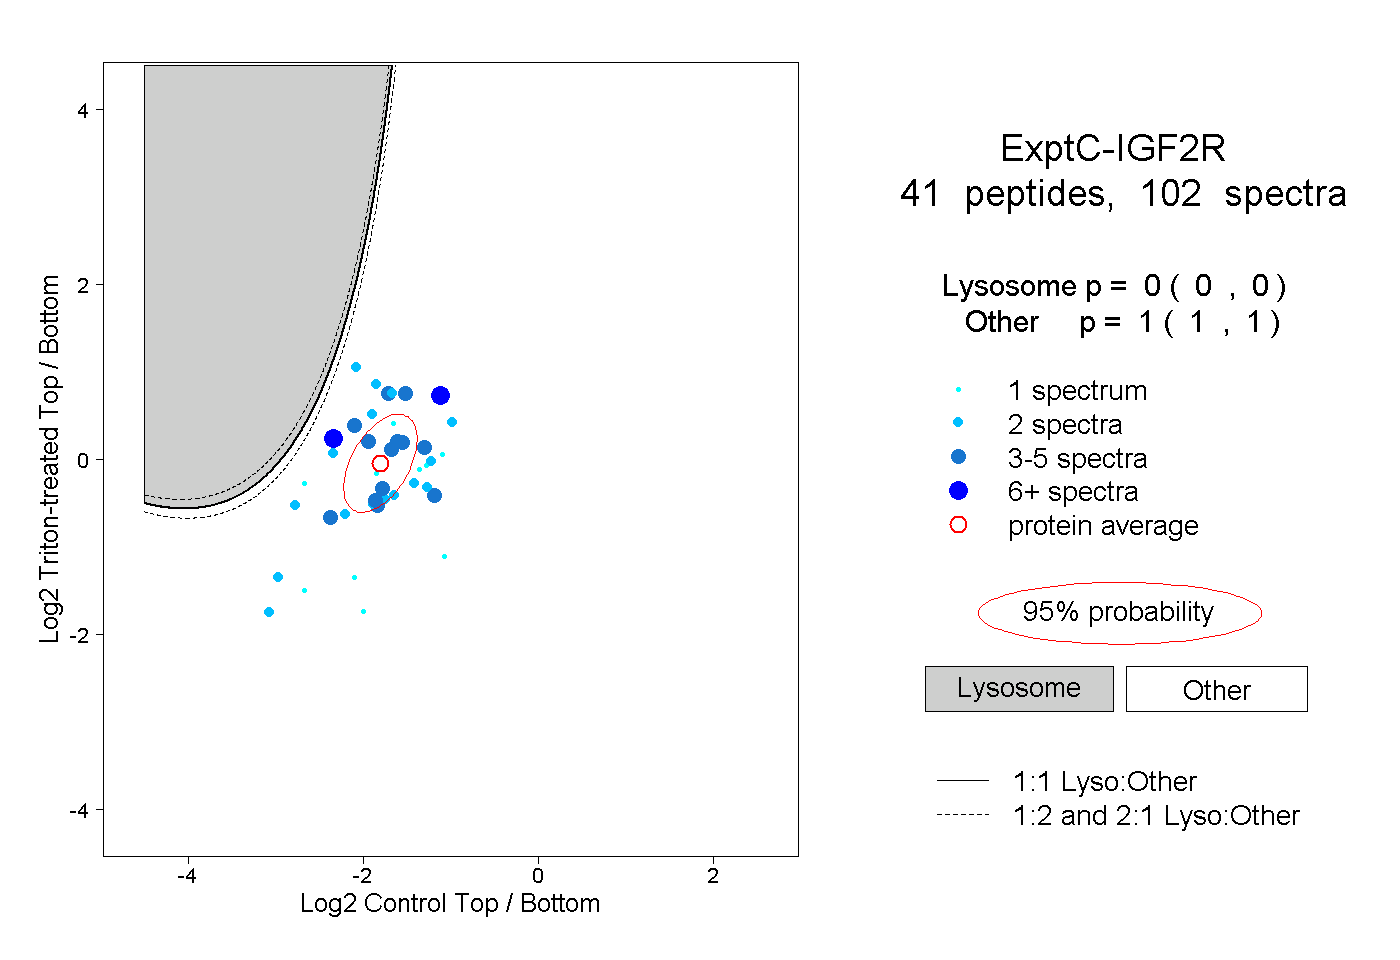
Lyso |
|
|
|
|
|
|
|
Other |
| Expt C |
41
peptides |
102
spectra |
 |
|
0.000
0.000 | 0.000 |
|
|
|
|
|
|
|
1.000
1.000 | 1.000 |
| | | Plot |
|
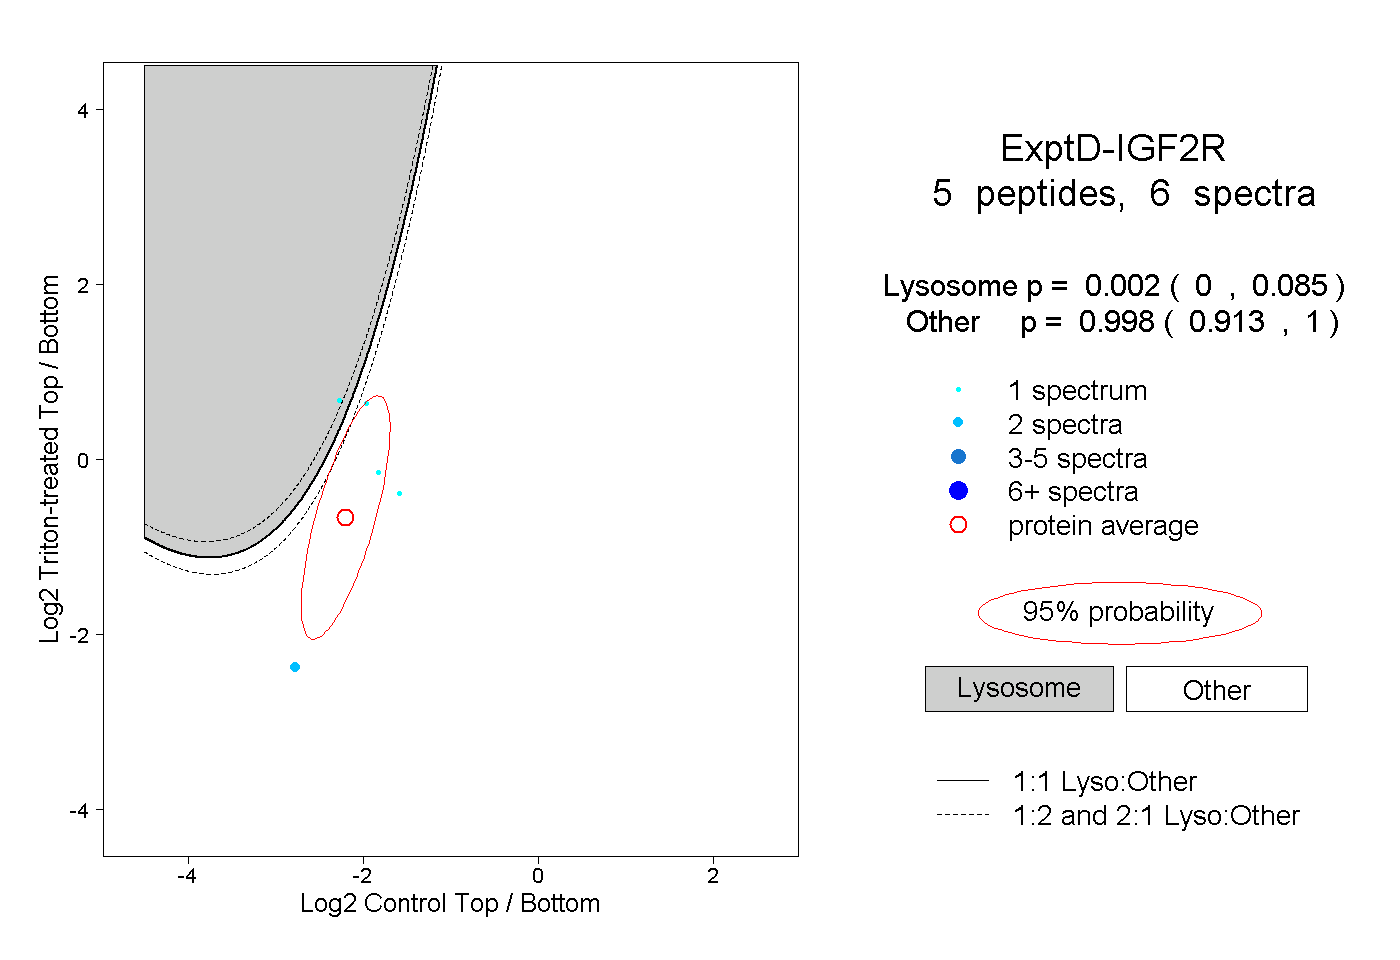
Lyso |
|
|
|
|
|
|
|
Other |
| Expt D |
5
peptides |
6
spectra |
 |
|
0.002
0.000 | 0.085 |
|
|
|
|
|
|
|
0.998
0.913 | 1.000 |