 27
27peptides
spectra
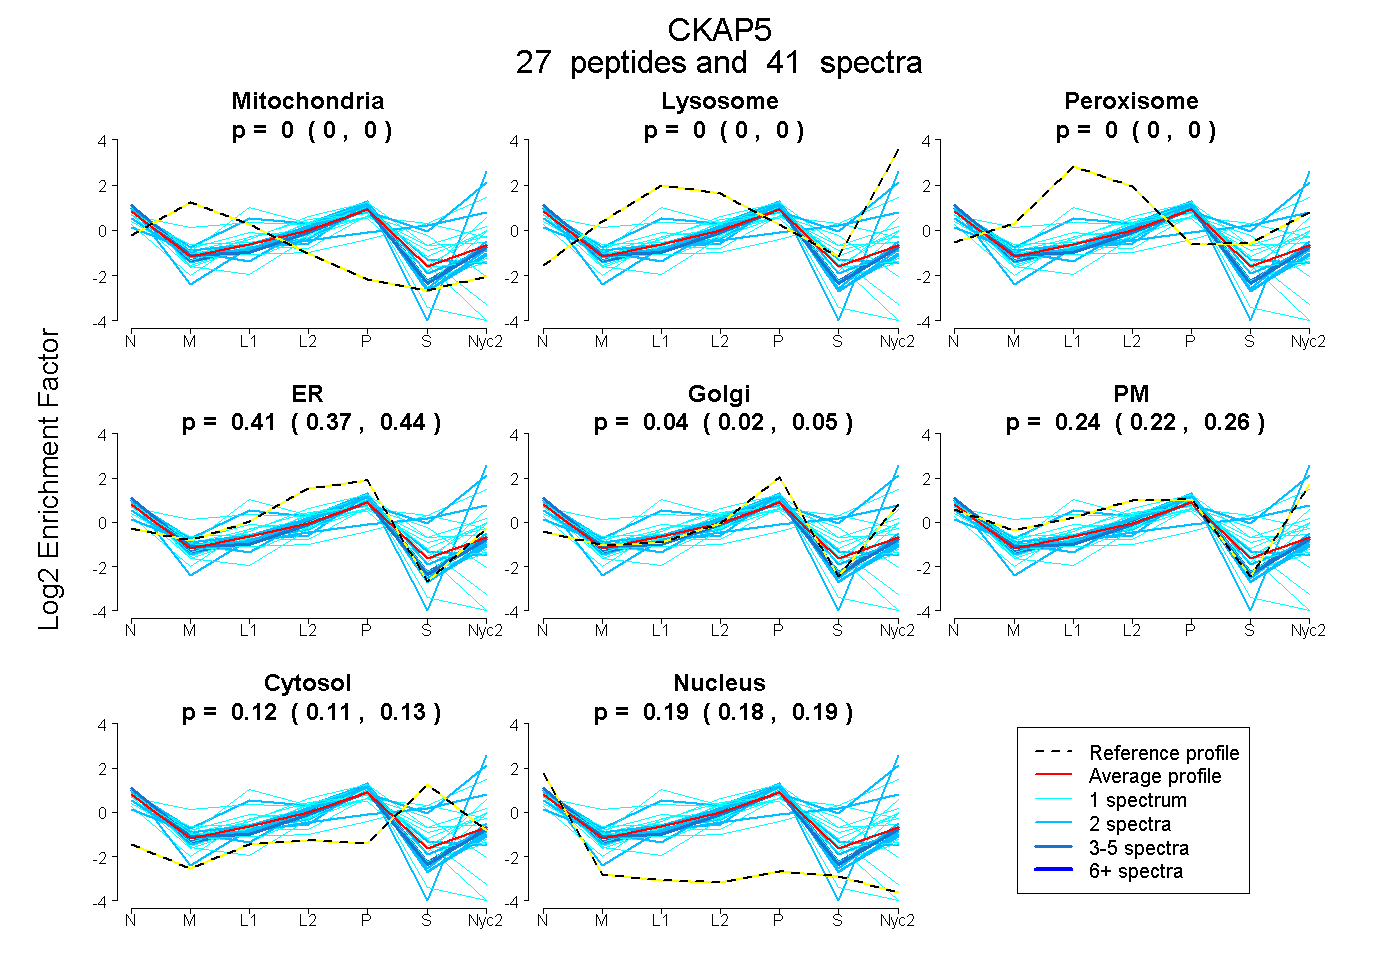
0.000 | 0.000
0.000 | 0.000
0.000 | 0.000
0.375 | 0.435
0.015 | 0.055
0.219 | 0.264
0.112 | 0.135
0.180 | 0.194
3peptides
spectra
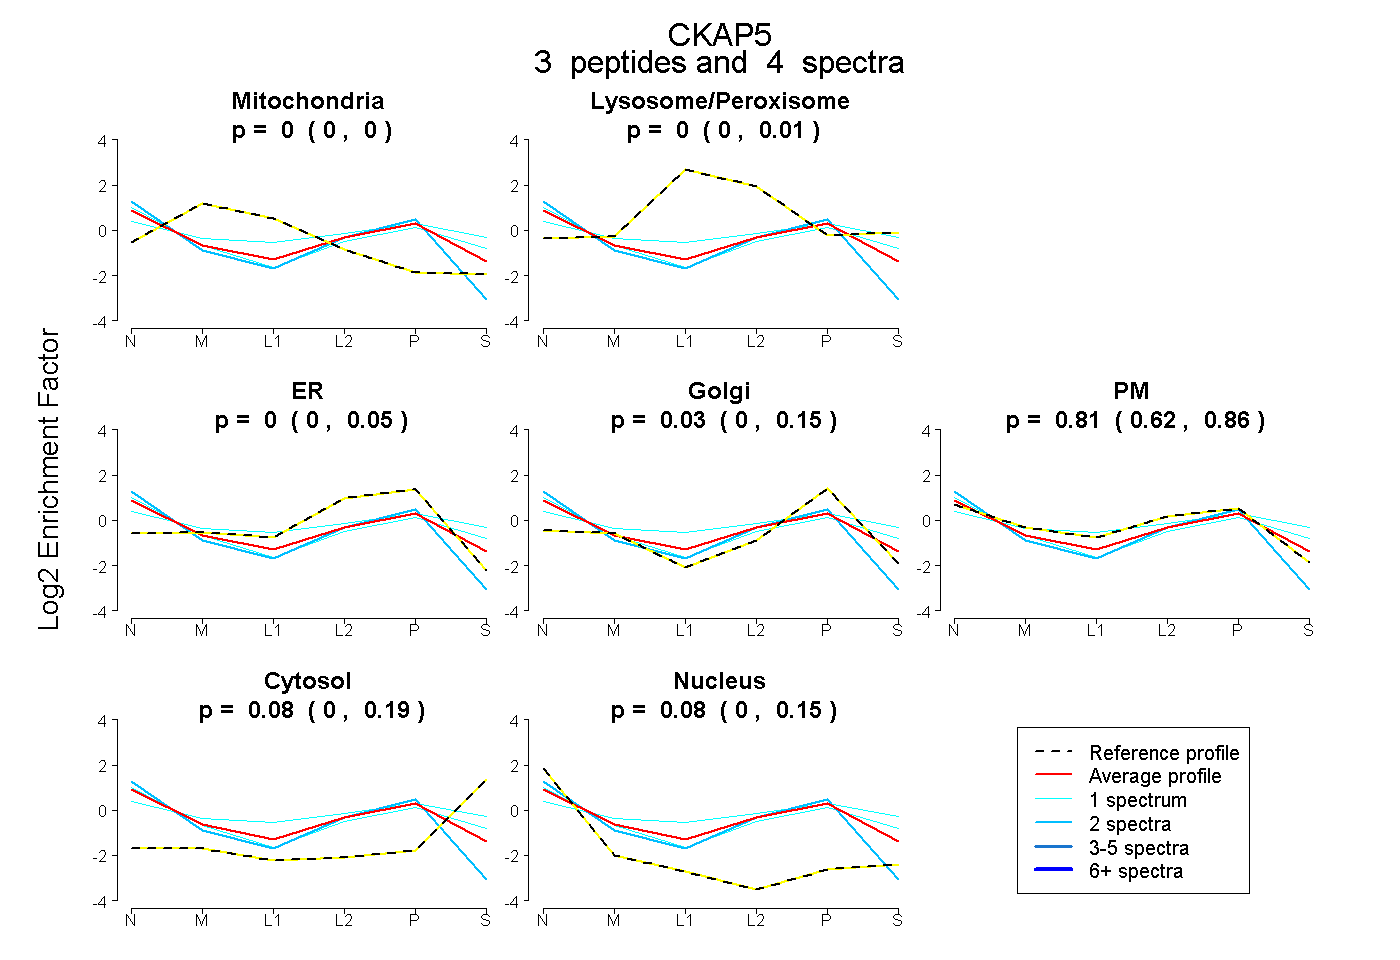
0.000 | 0.000
0.000 | 0.015
0.000 | 0.045
0.000 | 0.147
0.617 | 0.859
0.000 | 0.189
0.000 | 0.145
21peptides
spectra
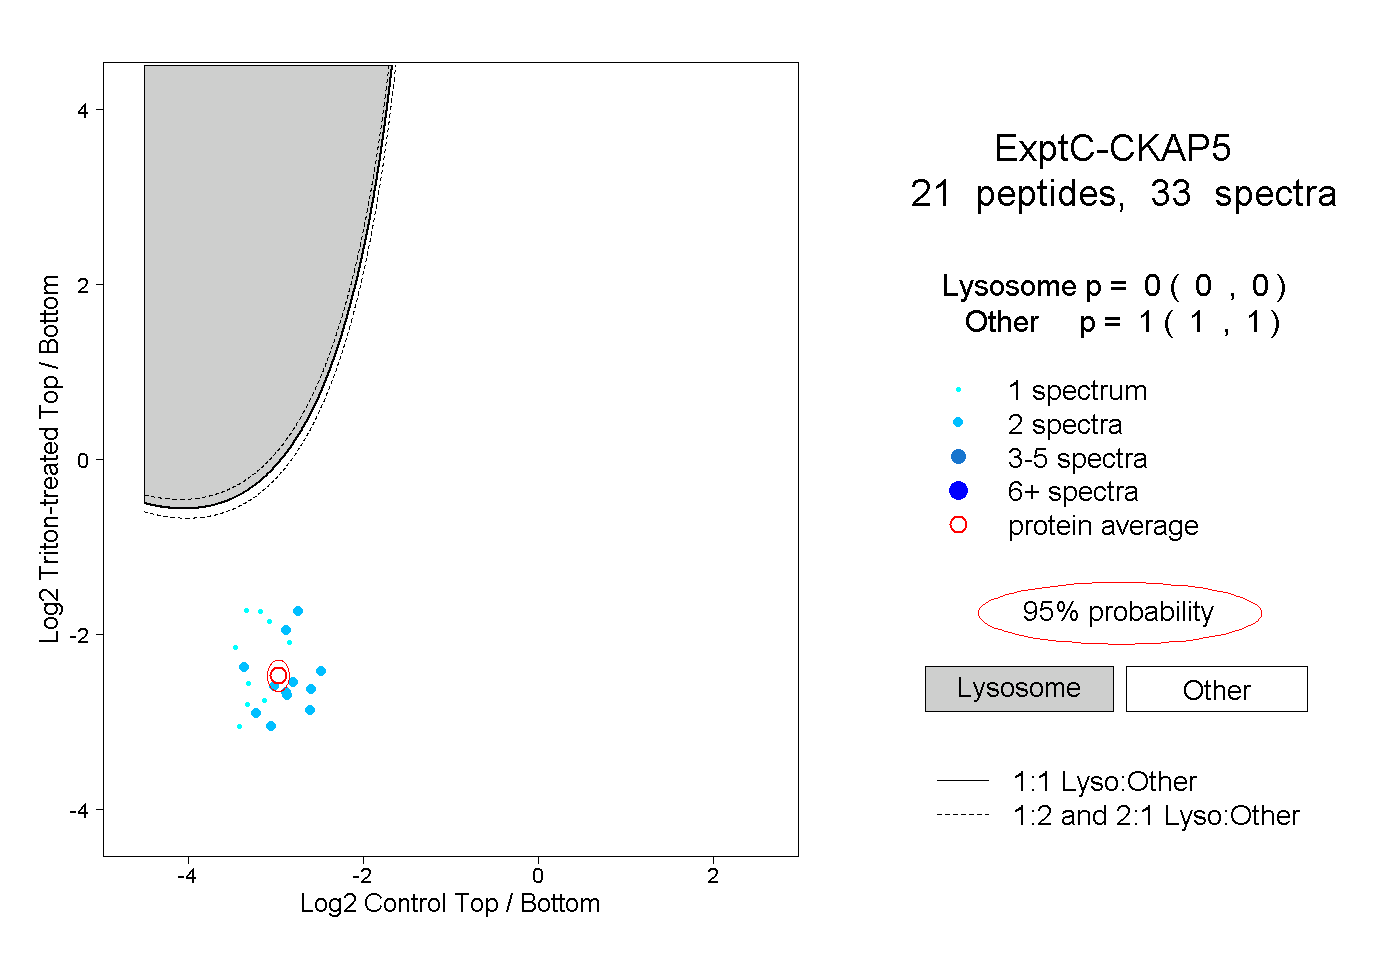
0.000 | 0.000
1.000 | 1.000
3peptides
spectra
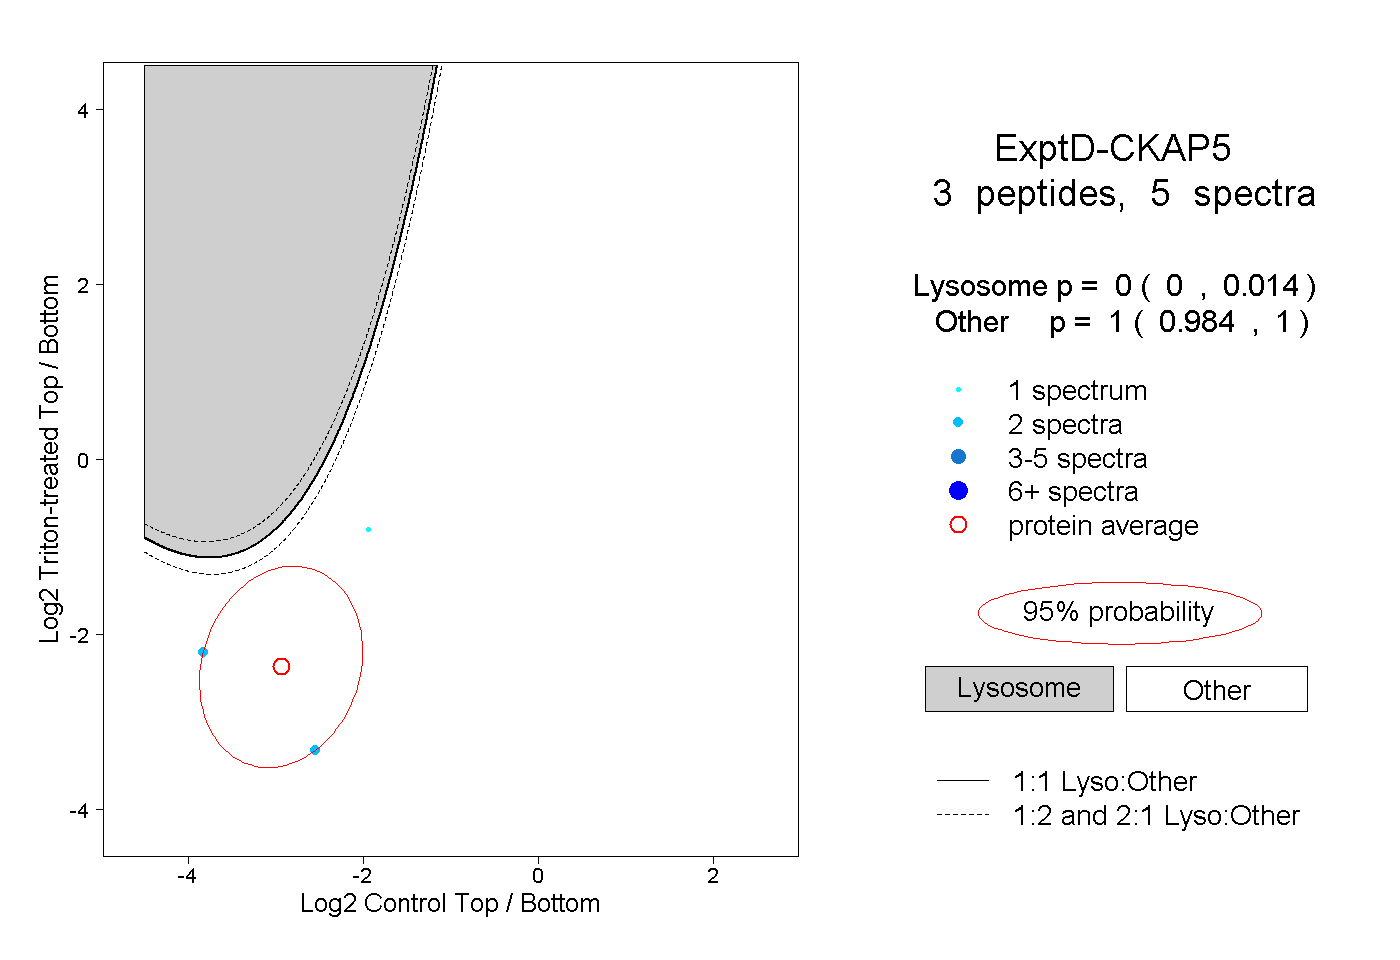
0.000 | 0.014
0.984 | 1.000