 27
27peptides
spectra
0.000 | 0.000
0.000 | 0.000
0.000 | 0.000
0.375 | 0.435
0.015 | 0.055
0.219 | 0.264
0.112 | 0.135
0.180 | 0.194
| Plot | Mito | Lyso | Perox | ER | Golgi | PM | Cytosol | Nucleus | |||||
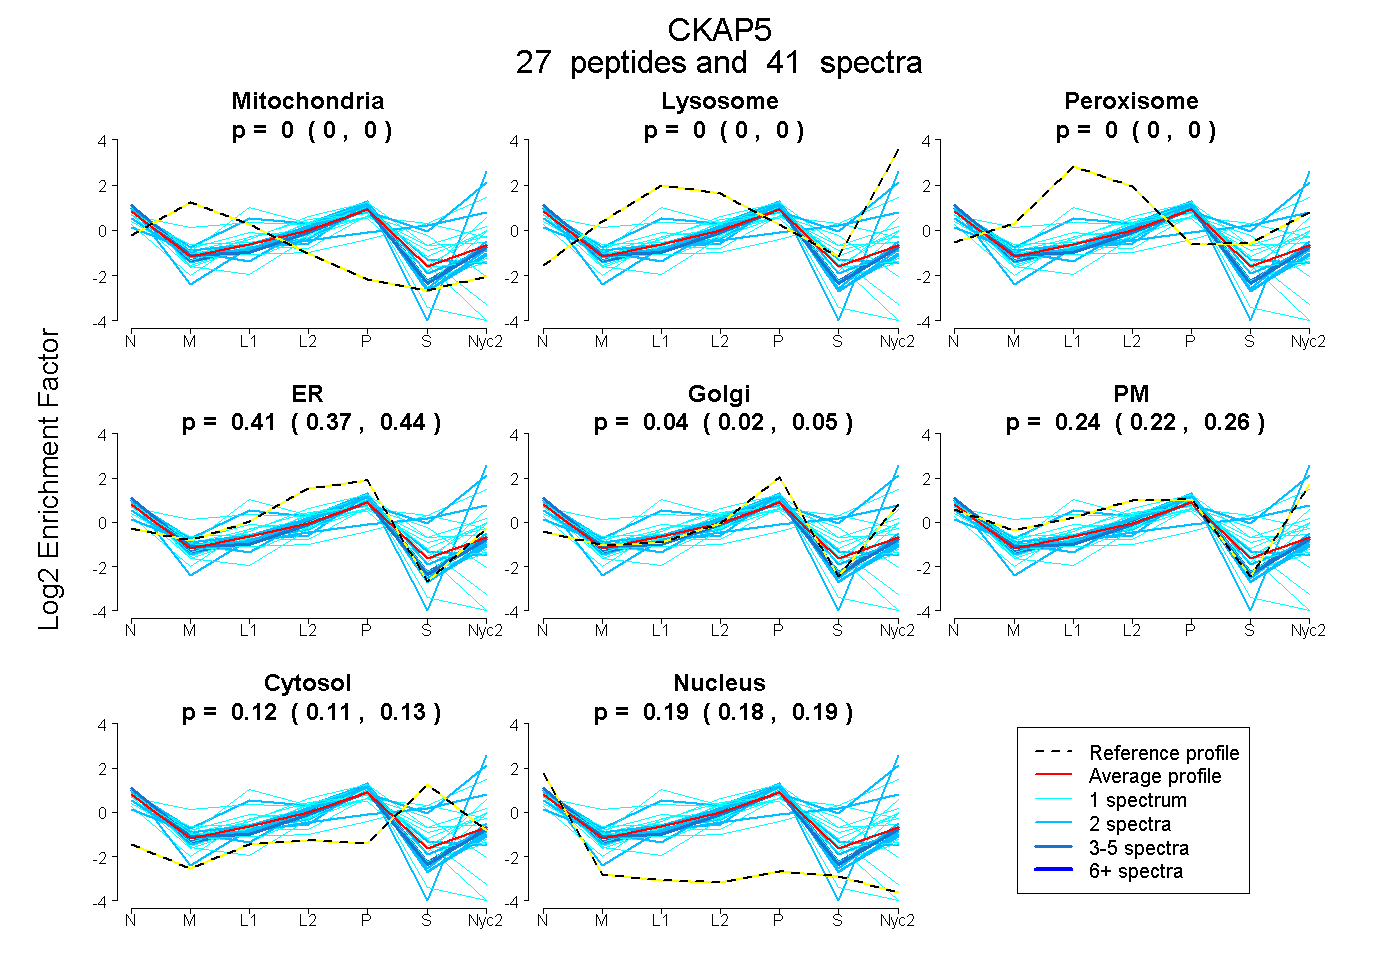
| Expt A |
27 peptides |
41 spectra |
|
0.000 0.000 | 0.000 |
0.000 0.000 | 0.000 |
0.000 0.000 | 0.000 |
0.406 0.375 | 0.435 |
0.037 0.015 | 0.055 |
0.245 0.219 | 0.264 |
0.125 0.112 | 0.135 |
0.187 0.180 | 0.194 |
| 1 spectrum, TSAQIVLDGLVDK | 0.000 | 0.000 | 0.220 | 0.015 | 0.241 | 0.223 | 0.138 | 0.164 | ||
| 2 spectra, TTGEVVSGVVSK | 0.000 | 0.193 | 0.000 | 0.000 | 0.059 | 0.444 | 0.304 | 0.000 | ||
| 1 spectrum, QELLGWLAEK | 0.000 | 0.000 | 0.000 | 0.513 | 0.000 | 0.000 | 0.000 | 0.487 | ||
| 1 spectrum, SLLKPFCAALLK | 0.000 | 0.000 | 0.007 | 0.706 | 0.000 | 0.000 | 0.087 | 0.201 | ||
| 1 spectrum, TTAPGGSASSGTK | 0.000 | 0.000 | 0.046 | 0.229 | 0.000 | 0.484 | 0.106 | 0.135 | ||
| 2 spectra, QAEEKPQR | 0.000 | 0.000 | 0.000 | 0.311 | 0.373 | 0.000 | 0.055 | 0.262 | ||
| 1 spectrum, GESVQEELLK | 0.000 | 0.000 | 0.000 | 0.417 | 0.000 | 0.000 | 0.376 | 0.207 | ||
| 1 spectrum, IIVACIETLR | 0.000 | 0.000 | 0.000 | 0.564 | 0.000 | 0.000 | 0.005 | 0.431 | ||
| 2 spectra, TALAATNPAVR | 0.000 | 0.000 | 0.000 | 0.529 | 0.098 | 0.126 | 0.000 | 0.248 | ||
| 2 spectra, MQGQSPPAPTR | 0.000 | 0.000 | 0.000 | 0.634 | 0.079 | 0.057 | 0.000 | 0.230 | ||
| 1 spectrum, SEMPCQALVK | 0.000 | 0.000 | 0.000 | 0.349 | 0.000 | 0.358 | 0.292 | 0.000 | ||
| 1 spectrum, DQVLAMLEK | 0.000 | 0.000 | 0.000 | 0.555 | 0.000 | 0.000 | 0.092 | 0.352 | ||
| 3 spectra, ELEEEWVK | 0.000 | 0.000 | 0.000 | 0.418 | 0.207 | 0.142 | 0.000 | 0.233 | ||
| 1 spectrum, LPTGAPKPSR | 0.000 | 0.000 | 0.000 | 0.716 | 0.012 | 0.000 | 0.000 | 0.273 | ||
| 1 spectrum, SVNLLVVK | 0.007 | 0.000 | 0.002 | 0.000 | 0.000 | 0.345 | 0.545 | 0.102 | ||
| 1 spectrum, HINDSAPEVR | 0.041 | 0.000 | 0.047 | 0.252 | 0.000 | 0.291 | 0.276 | 0.093 | ||
| 1 spectrum, EALEAVEGLVR | 0.000 | 0.000 | 0.000 | 0.615 | 0.031 | 0.075 | 0.000 | 0.279 | ||
| 1 spectrum, ENPFLR | 0.000 | 0.000 | 0.000 | 0.302 | 0.142 | 0.364 | 0.000 | 0.192 | ||
| 1 spectrum, AGGPPK | 0.000 | 0.091 | 0.000 | 0.000 | 0.000 | 0.465 | 0.444 | 0.000 | ||
| 2 spectra, QQTSLFIAR | 0.000 | 0.000 | 0.000 | 0.652 | 0.000 | 0.099 | 0.000 | 0.249 | ||
| 2 spectra, VNDFLAEIFK | 0.000 | 0.000 | 0.000 | 0.000 | 0.000 | 0.489 | 0.511 | 0.000 | ||
| 4 spectra, WNFTTPR | 0.000 | 0.000 | 0.000 | 0.380 | 0.115 | 0.232 | 0.000 | 0.273 | ||
| 2 spectra, DEYIEQLK | 0.000 | 0.000 | 0.000 | 0.576 | 0.020 | 0.000 | 0.169 | 0.235 | ||
| 1 spectrum, YLGLIK | 0.000 | 0.000 | 0.415 | 0.098 | 0.238 | 0.110 | 0.000 | 0.139 | ||
| 2 spectra, LHIVALIAQK | 0.000 | 0.000 | 0.000 | 0.339 | 0.235 | 0.196 | 0.000 | 0.230 | ||
| 2 spectra, DTNVMLVALAAK | 0.000 | 0.000 | 0.000 | 0.000 | 0.000 | 1.000 | 0.000 | 0.000 | ||
| 1 spectrum, SQQELEAK | 0.185 | 0.000 | 0.088 | 0.000 | 0.037 | 0.635 | 0.037 | 0.017 |
| Plot | Mito | Lyso or Perox | ER | Golgi | PM | Cytosol | Nucleus | ||||||
| Expt B |
3 peptides |
4 spectra |
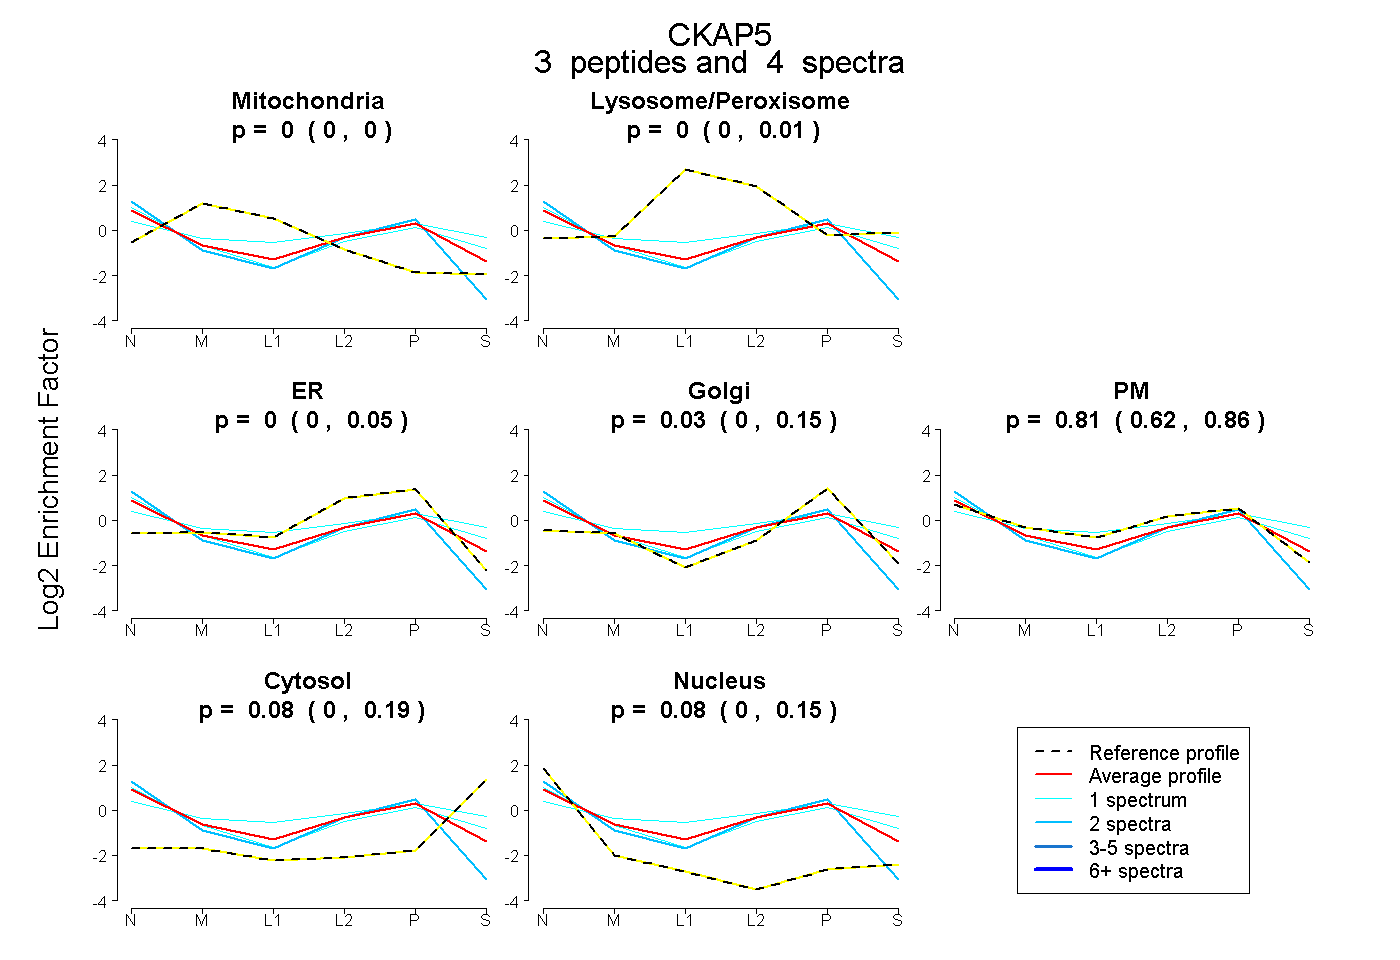 |
0.000 0.000 | 0.000 |
0.000 0.000 | 0.015 |
0.000 0.000 | 0.045 |
0.034 0.000 | 0.147 |
0.806 0.617 | 0.859 |
0.079 0.000 | 0.189 |
0.082 0.000 | 0.145 |
|||
| Plot | Lyso | Other | |||||||||||
| Expt C |
21 peptides |
33 spectra |
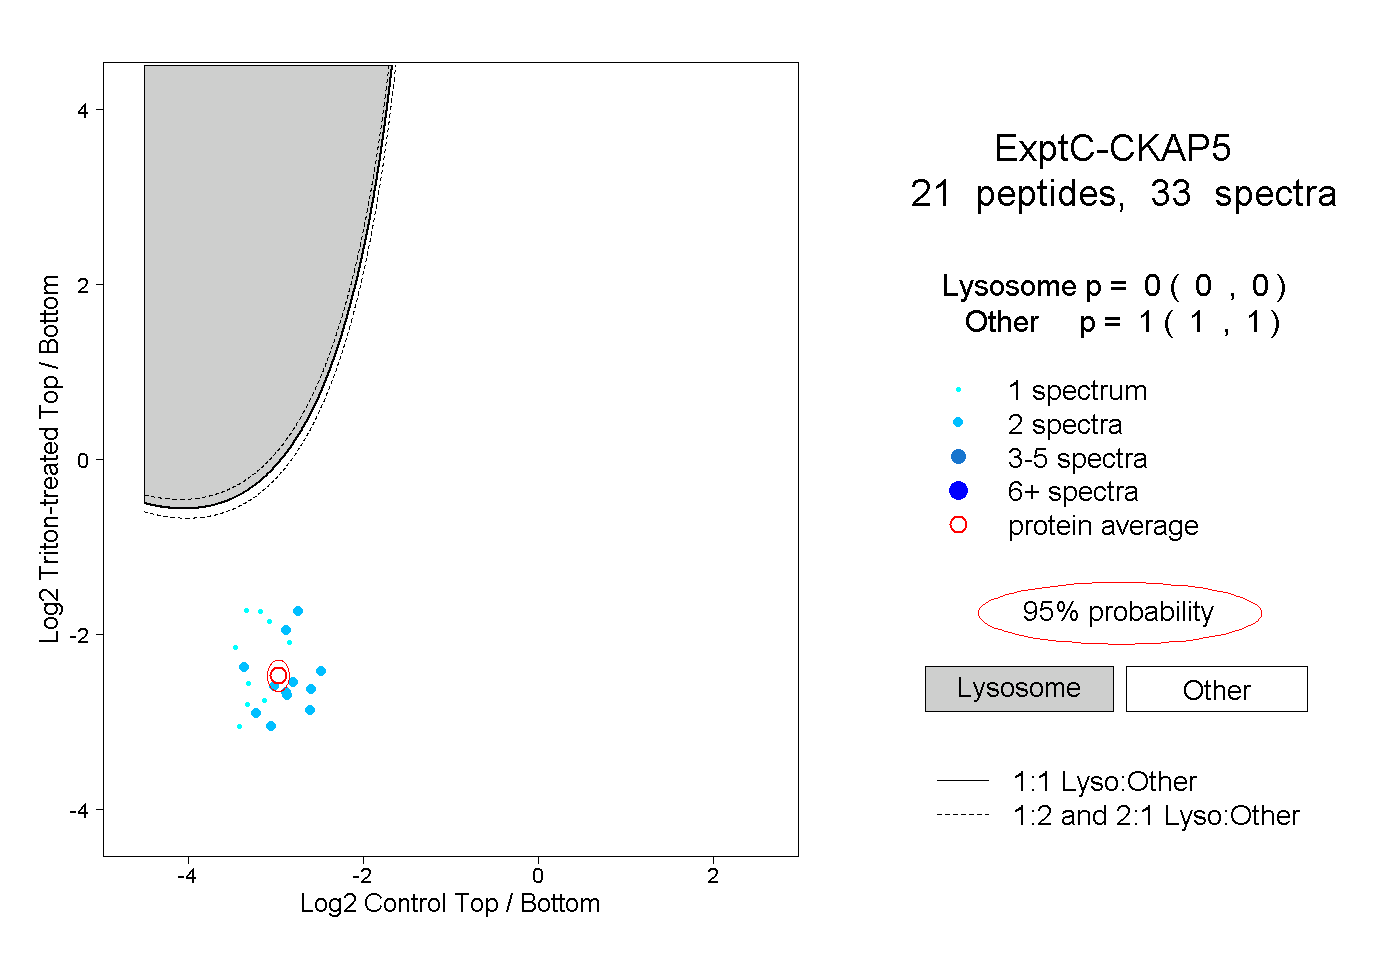 |
0.000 0.000 | 0.000 |
1.000 1.000 | 1.000 |
||||||||
| Plot | Lyso | Other | |||||||||||
| Expt D |
3 peptides |
5 spectra |
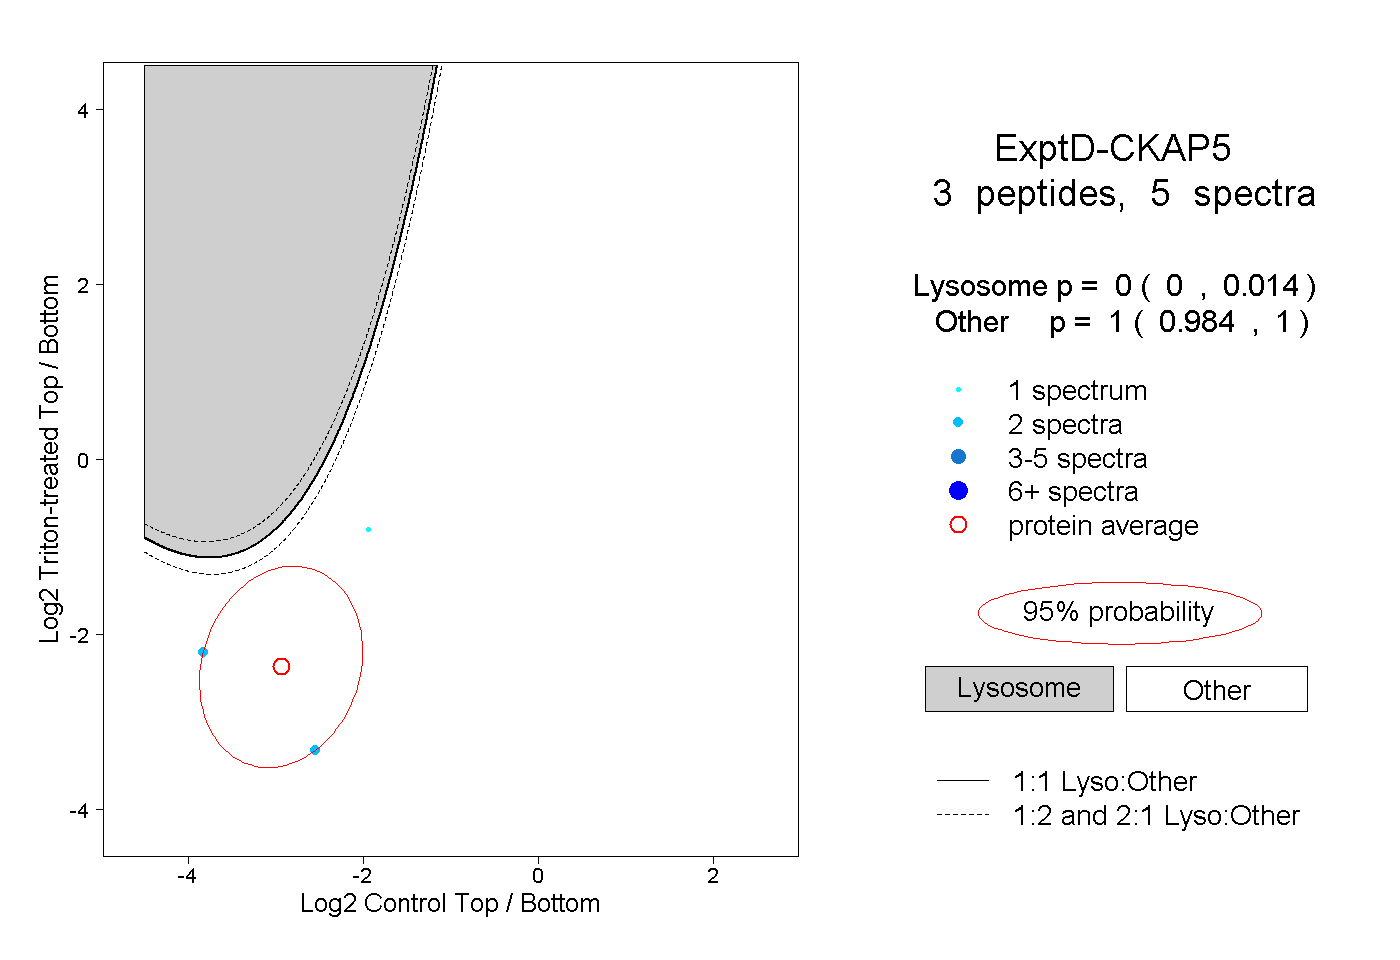 |
0.000 0.000 | 0.014 |
1.000 0.984 | 1.000 |