 5
5peptides
spectra
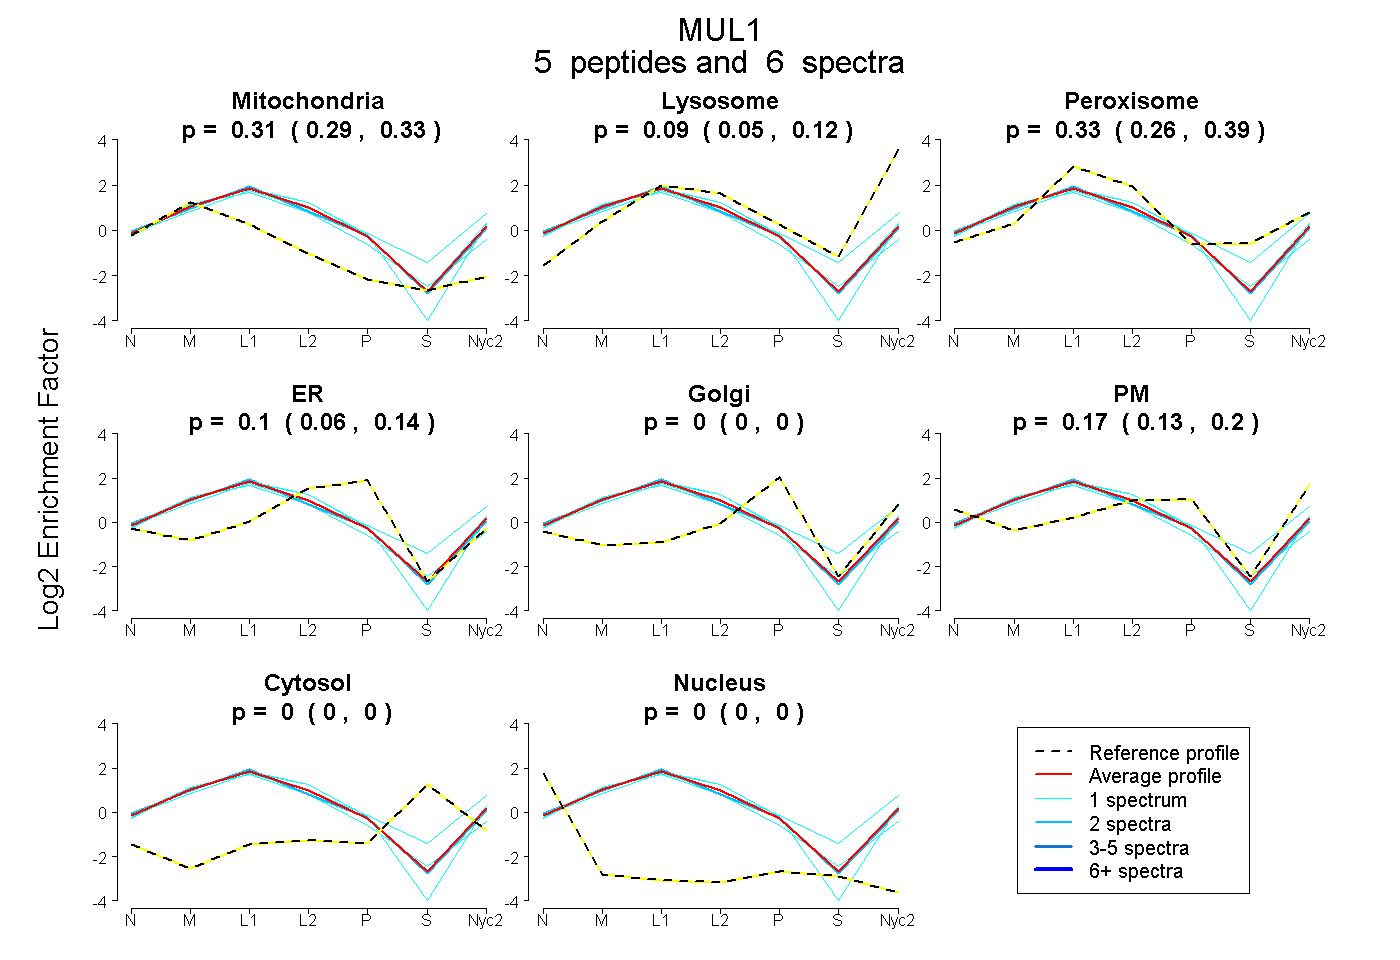
0.286 | 0.334
0.054 | 0.122
0.255 | 0.391
0.057 | 0.138
0.000 | 0.000
0.125 | 0.198
0.000 | 0.000
0.000 | 0.000
1peptide
spectrum
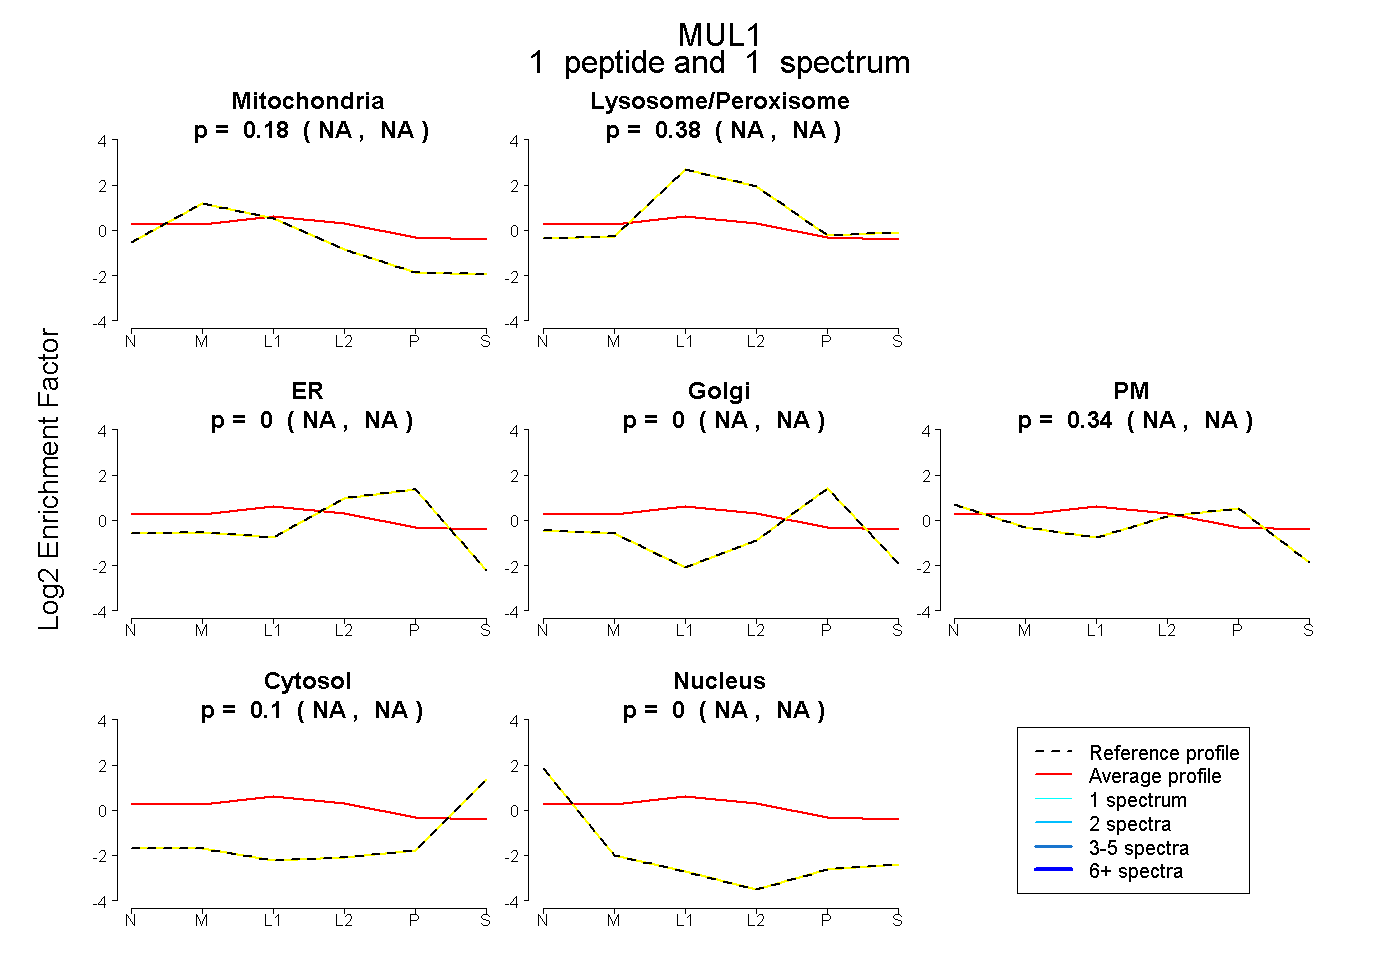
NA | NA
NA | NA
NA | NA
NA | NA
NA | NA
NA | NA
NA | NA
7peptides
spectra
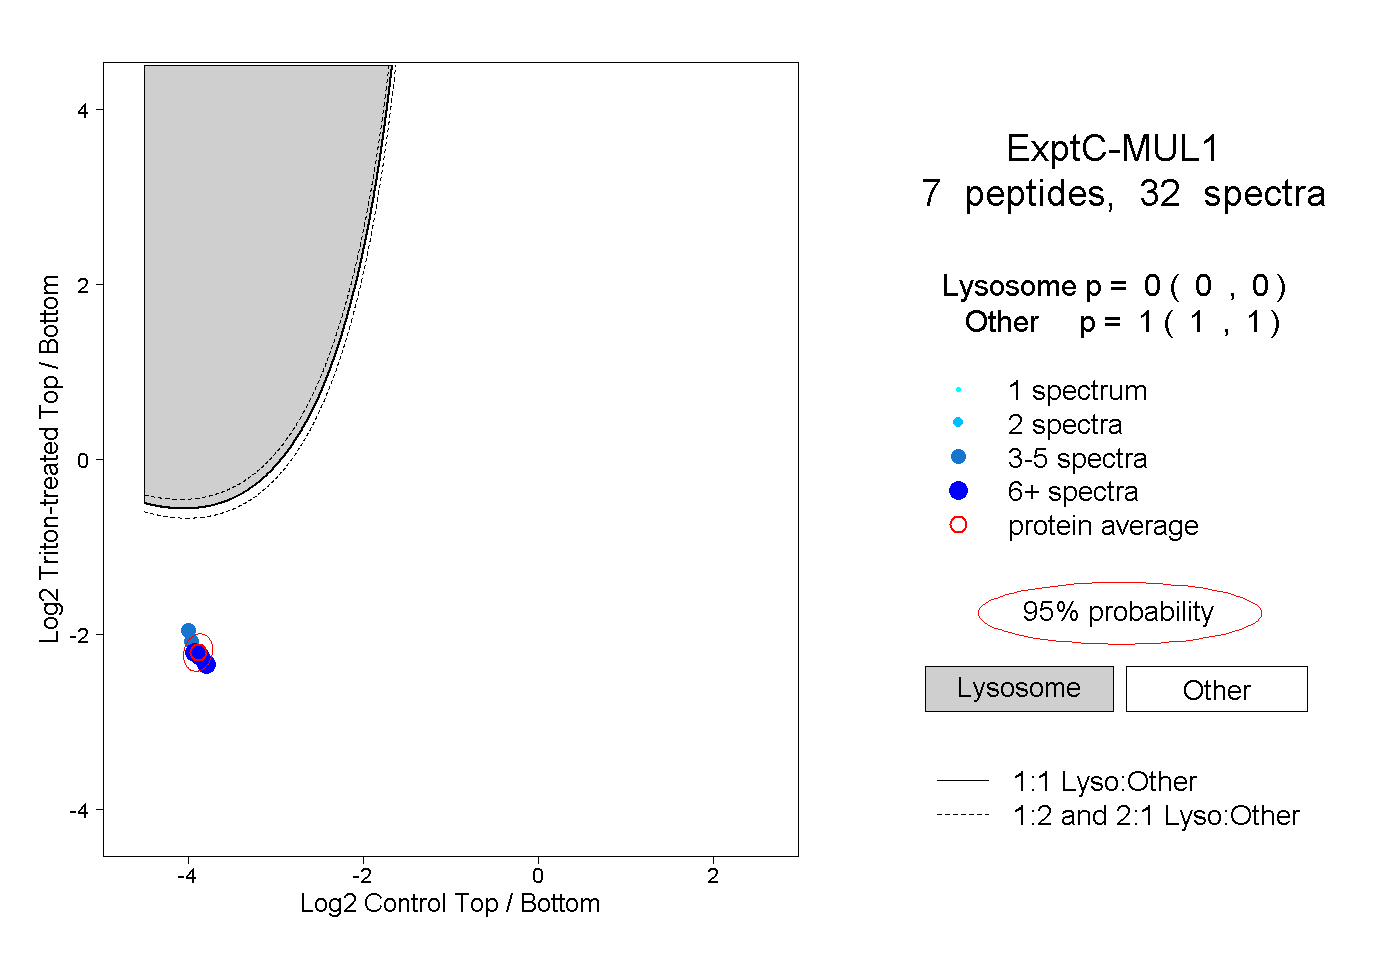
0.000 | 0.000
1.000 | 1.000
1peptide
spectrum
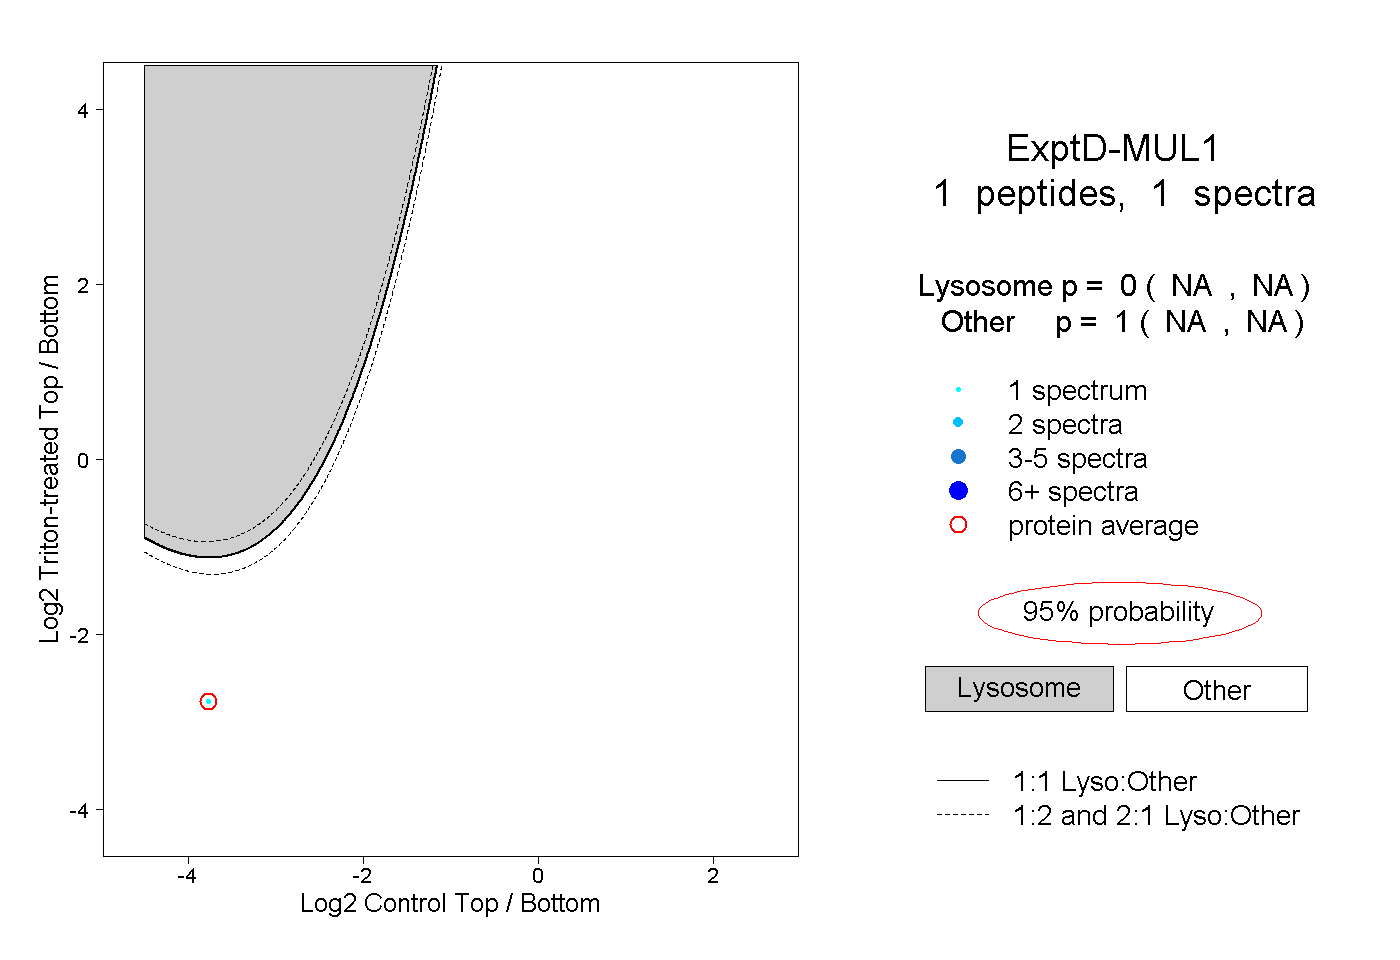
NA | NA
NA | NA