 5
5peptides
spectra
0.286 | 0.334
0.054 | 0.122
0.255 | 0.391
0.057 | 0.138
0.000 | 0.000
0.125 | 0.198
0.000 | 0.000
0.000 | 0.000
| Plot | Mito | Lyso | Perox | ER | Golgi | PM | Cytosol | Nucleus | |||||
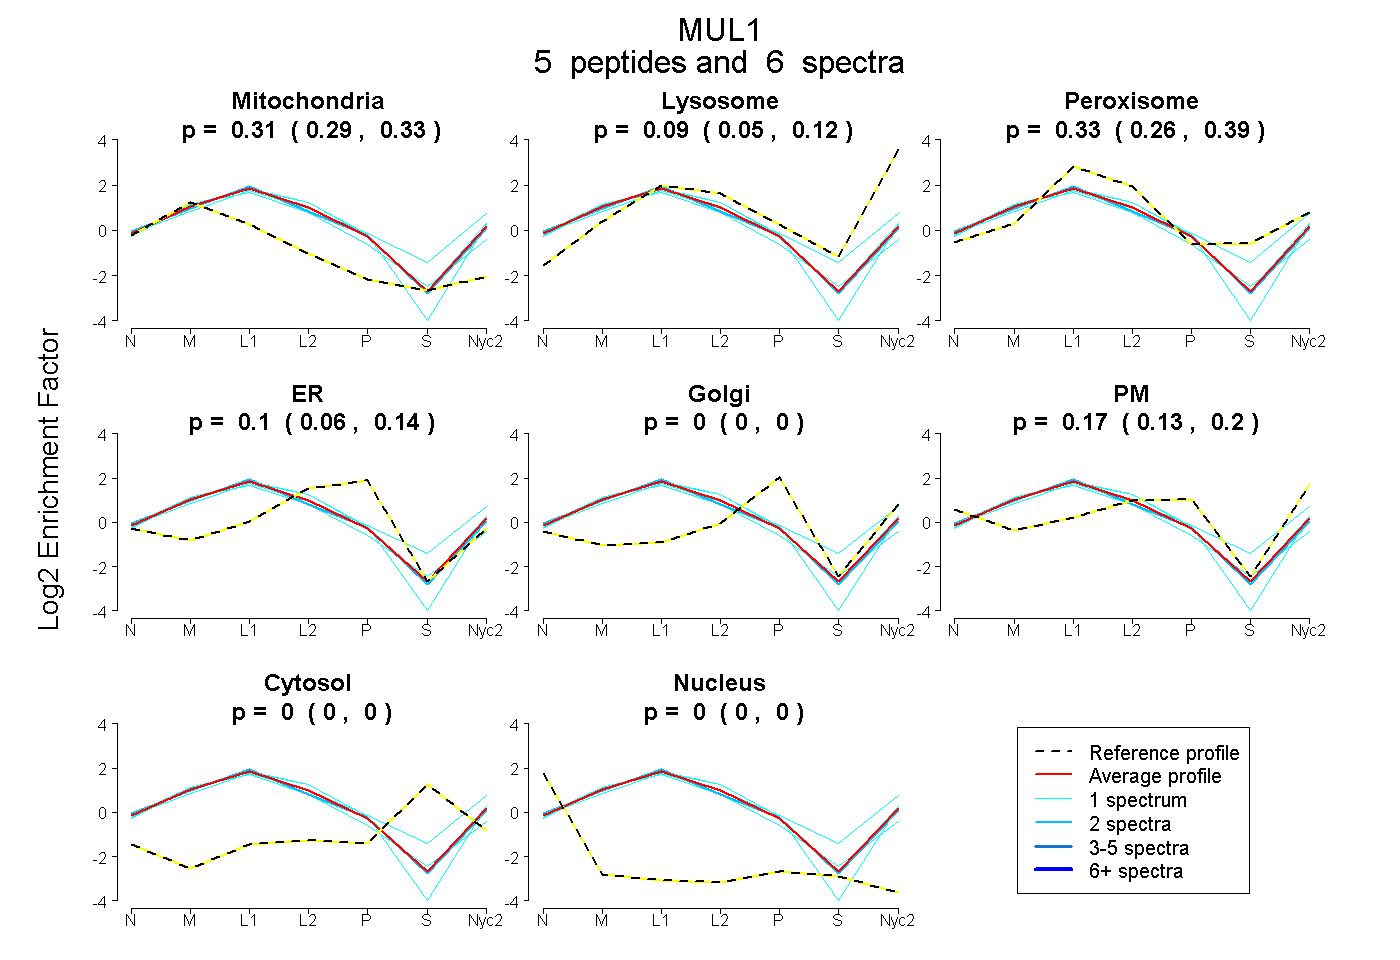
| Expt A |
5 peptides |
6 spectra |
|
0.313 0.286 | 0.334 |
0.090 0.054 | 0.122 |
0.330 0.255 | 0.391 |
0.102 0.057 | 0.138 |
0.000 0.000 | 0.000 |
0.165 0.125 | 0.198 |
0.000 0.000 | 0.000 |
0.000 0.000 | 0.000 |
| 1 spectrum, TNTVPFDLVPHEDGVAMAVR | 0.351 | 0.160 | 0.114 | 0.183 | 0.000 | 0.193 | 0.000 | 0.000 | ||
| 1 spectrum, IHLGEDLK | 0.288 | 0.148 | 0.320 | 0.162 | 0.000 | 0.082 | 0.000 | 0.000 | ||
| 1 spectrum, CVPYAVIEGAVR | 0.416 | 0.047 | 0.371 | 0.141 | 0.000 | 0.026 | 0.000 | 0.000 | ||
| 1 spectrum, AQVAQELK | 0.195 | 0.107 | 0.463 | 0.000 | 0.000 | 0.235 | 0.000 | 0.000 | ||
| 2 spectra, GVQETEEMLK | 0.321 | 0.033 | 0.354 | 0.085 | 0.000 | 0.208 | 0.000 | 0.000 |
| Plot | Mito | Lyso or Perox | ER | Golgi | PM | Cytosol | Nucleus | ||||||
| Expt B |
1 peptide |
1 spectrum |
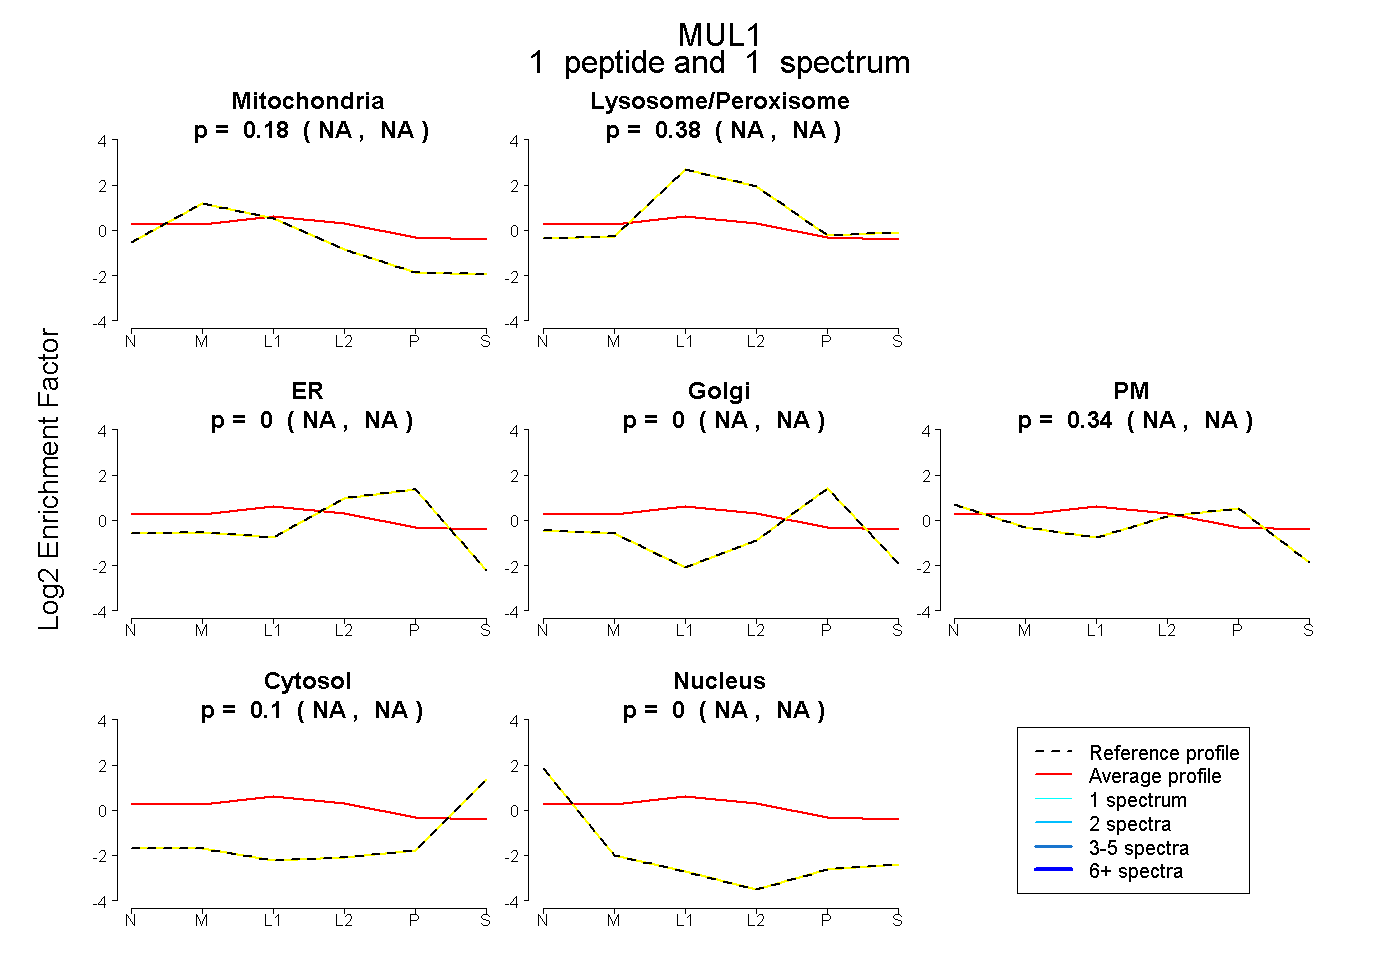 |
0.176 NA | NA |
0.379 NA | NA |
0.000 NA | NA |
0.000 NA | NA |
0.343 NA | NA |
0.102 NA | NA |
0.000 NA | NA |
|||
| Plot | Lyso | Other | |||||||||||
| Expt C |
7 peptides |
32 spectra |
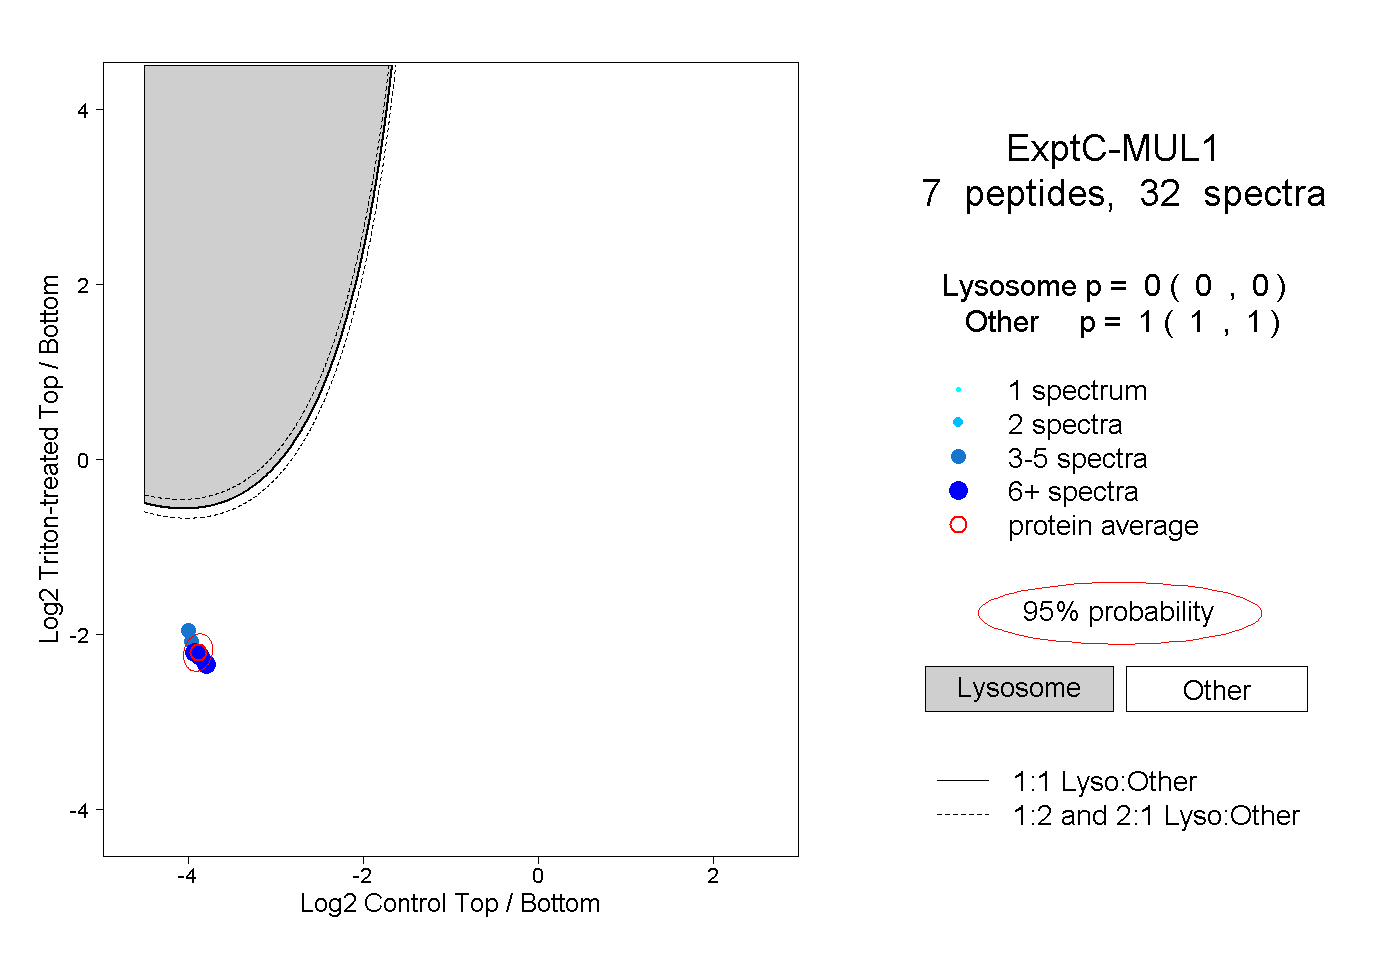 |
0.000 0.000 | 0.000 |
1.000 1.000 | 1.000 |
||||||||
| Plot | Lyso | Other | |||||||||||
| Expt D |
1 peptide |
1 spectrum |
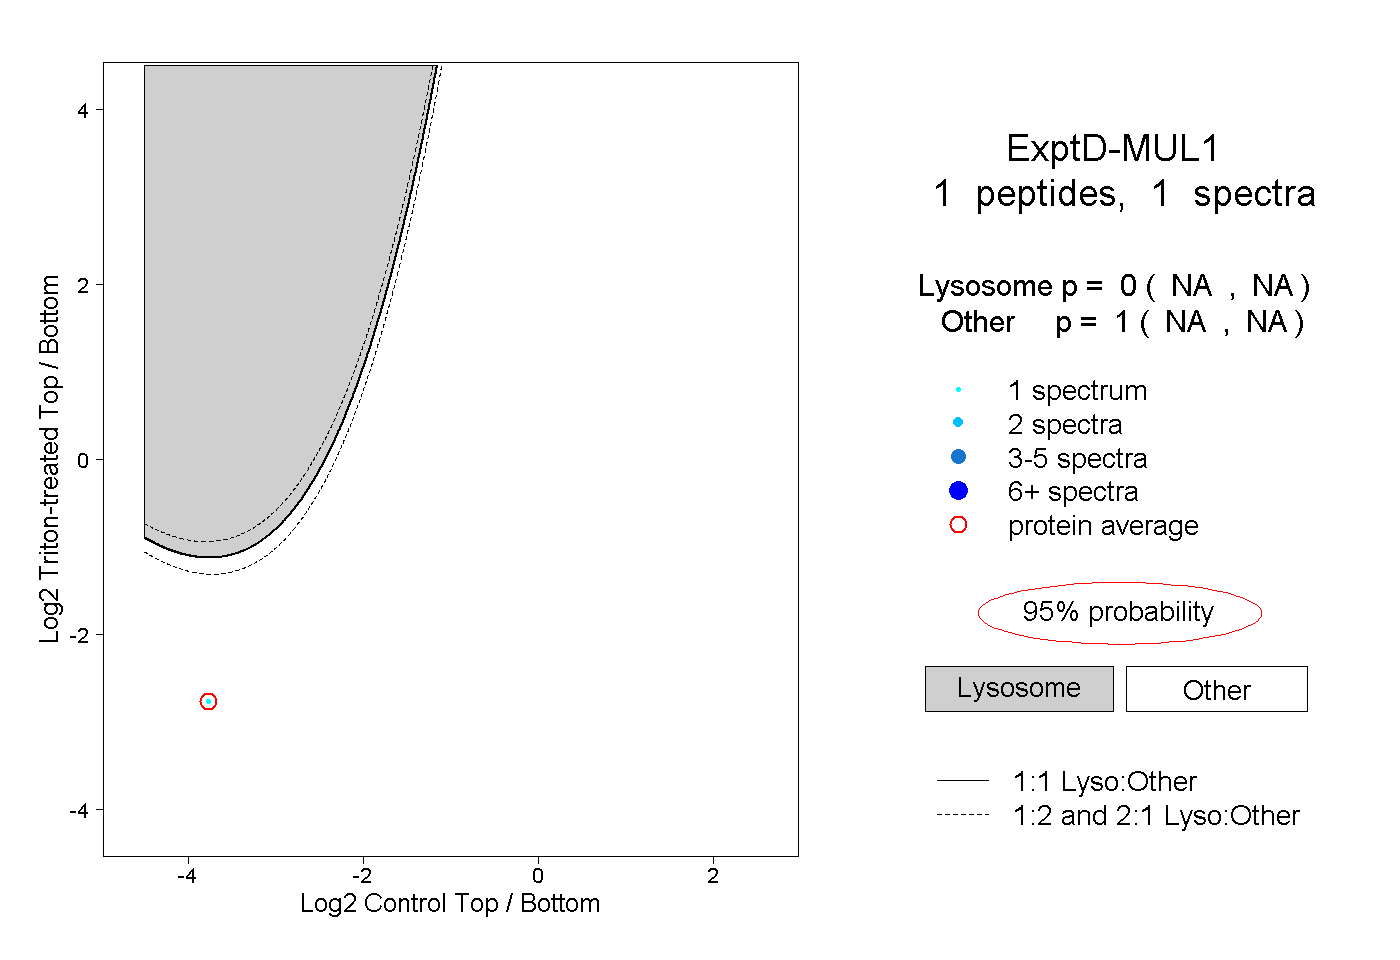 |
0.000 NA | NA |
1.000 NA | NA |