 2
2peptides
spectra
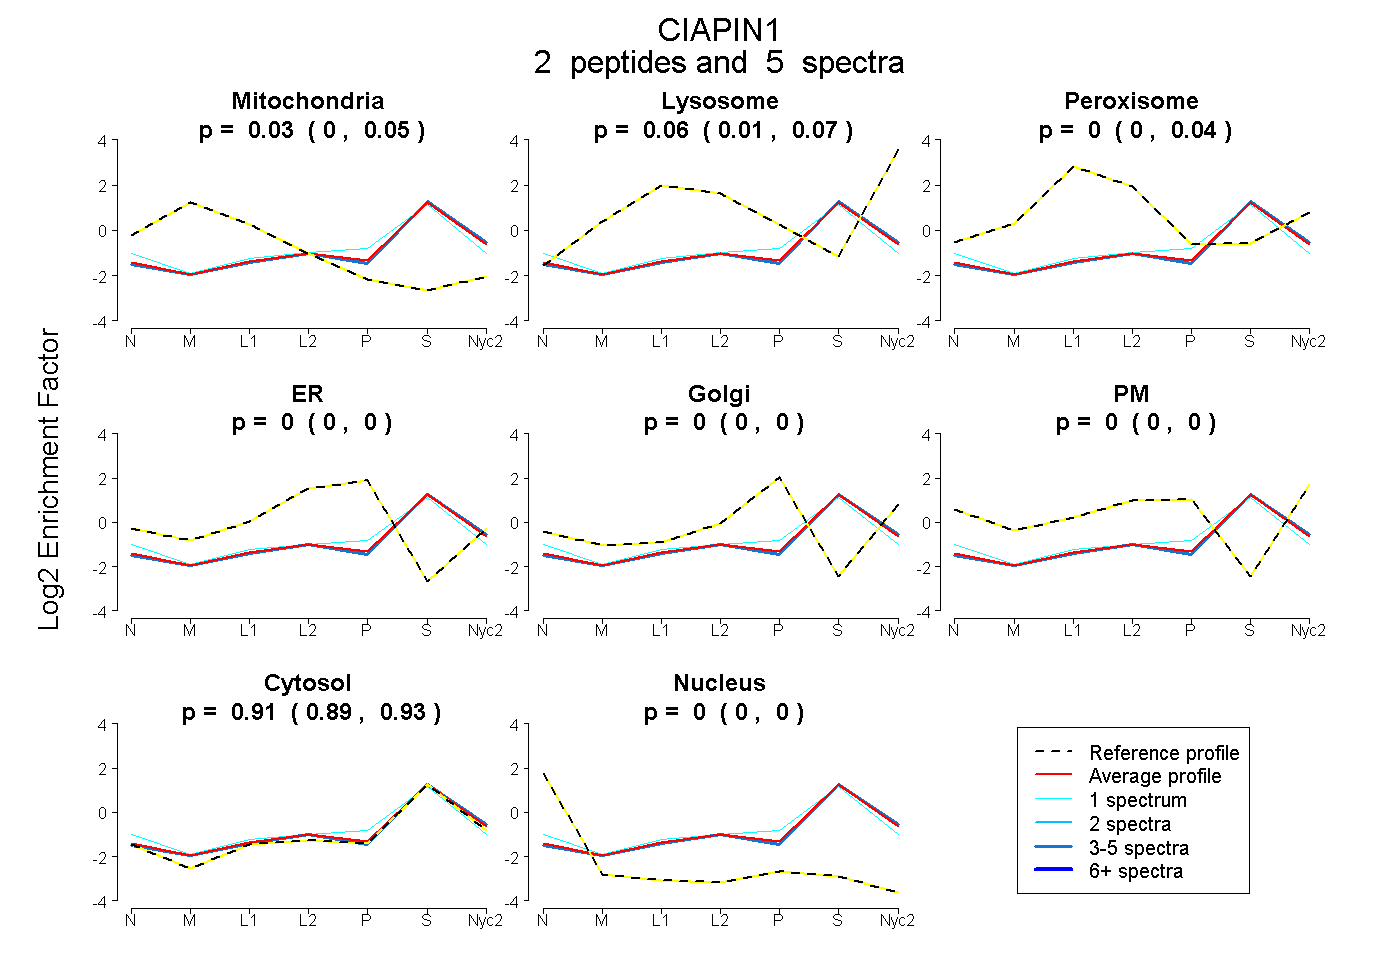
0.000 | 0.047
0.007 | 0.075
0.000 | 0.043
0.000 | 0.000
0.000 | 0.000
0.000 | 0.000
0.890 | 0.935
0.000 | 0.000
1peptide
spectra
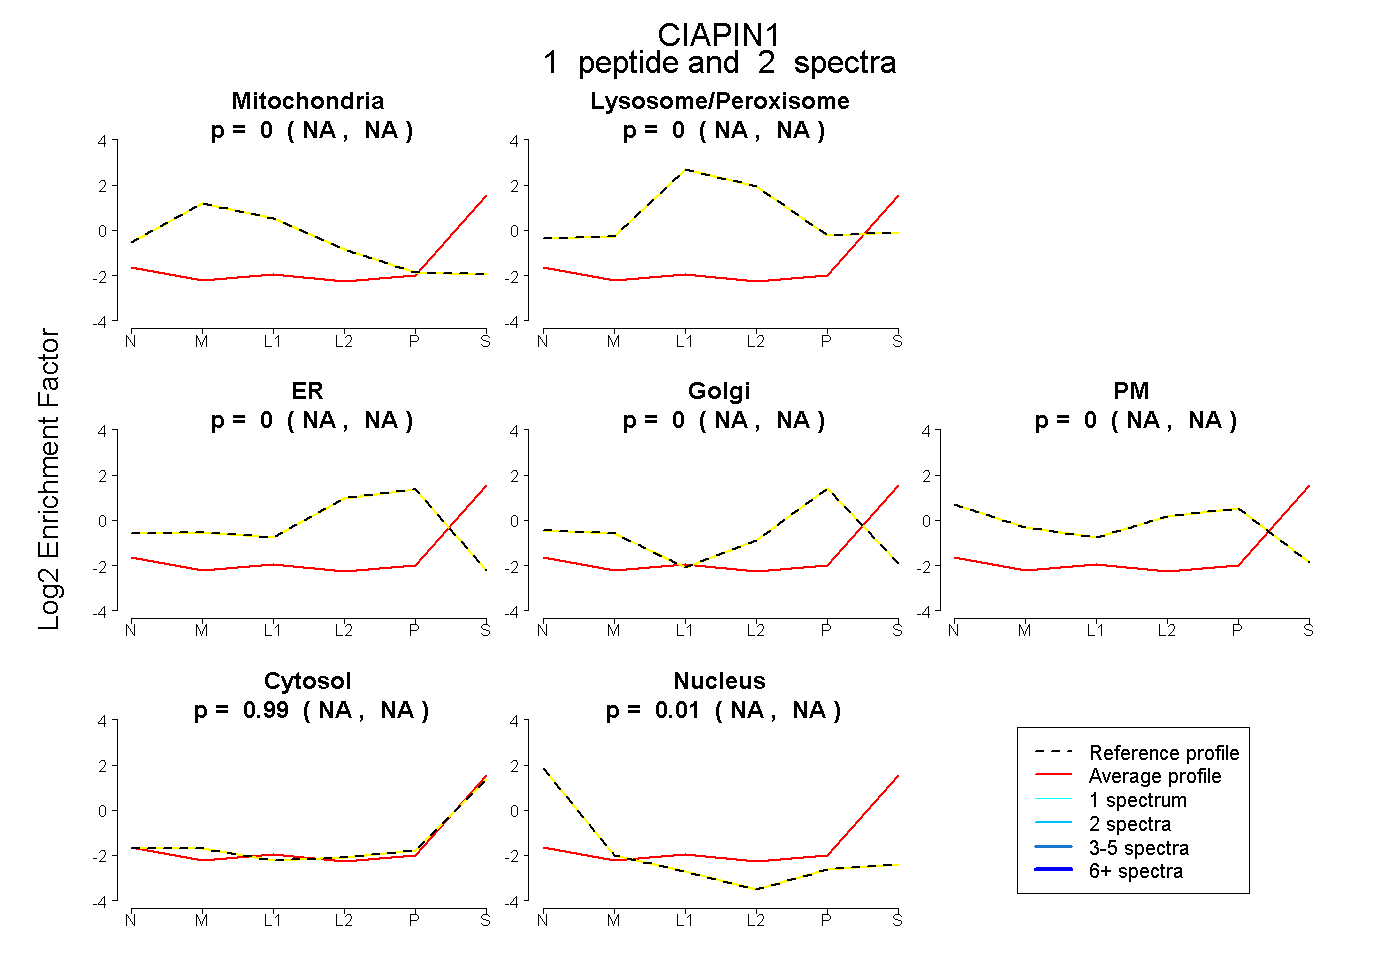
NA | NA
NA | NA
NA | NA
NA | NA
NA | NA
NA | NA
NA | NA
4peptides
spectra
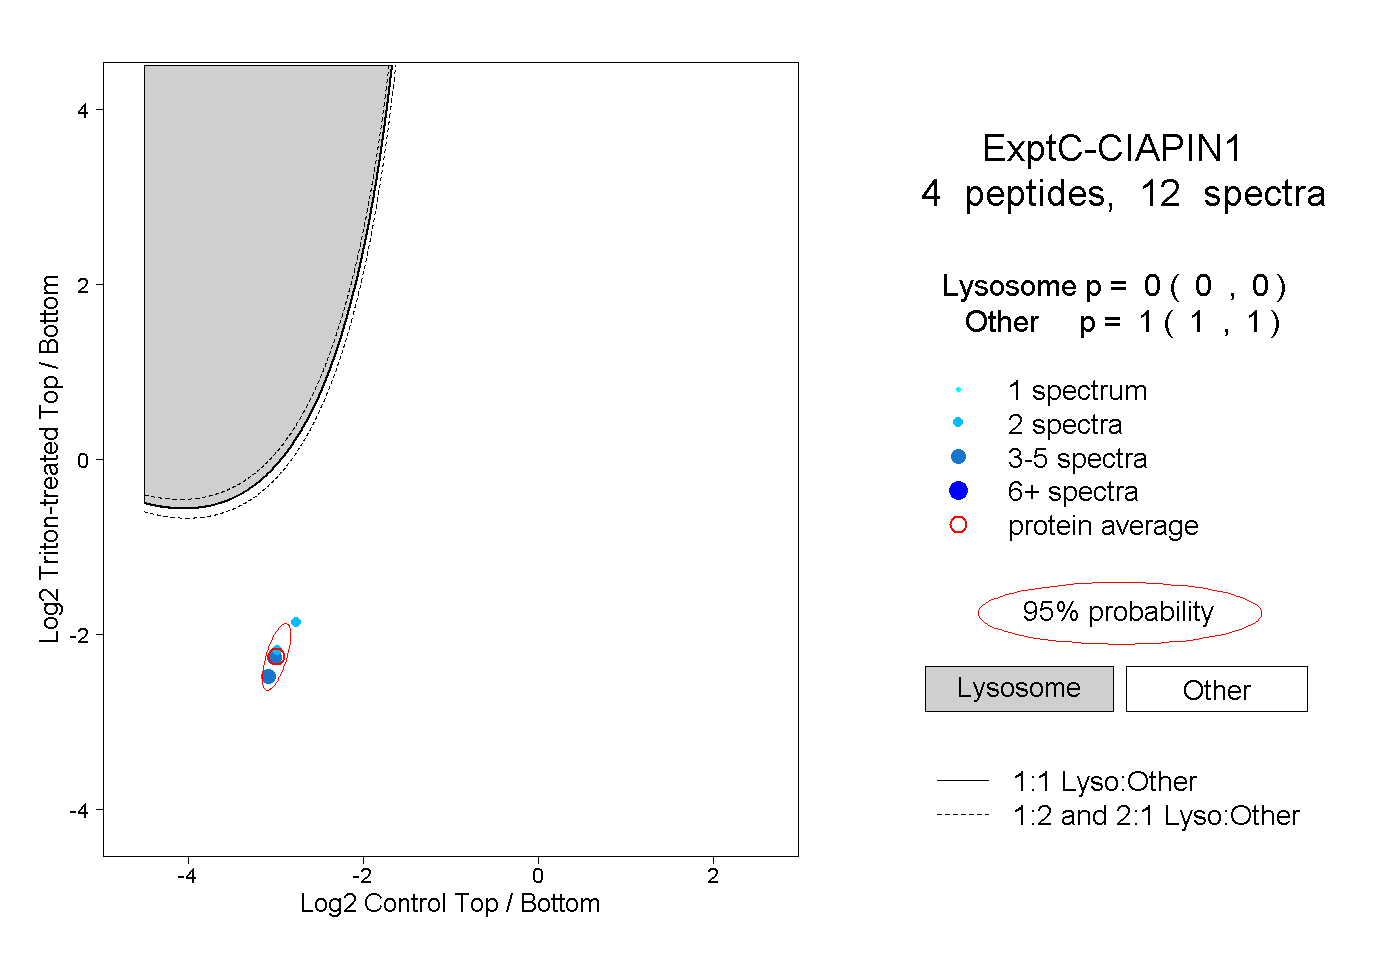
0.000 | 0.000
1.000 | 1.000