 2
2peptides
spectra
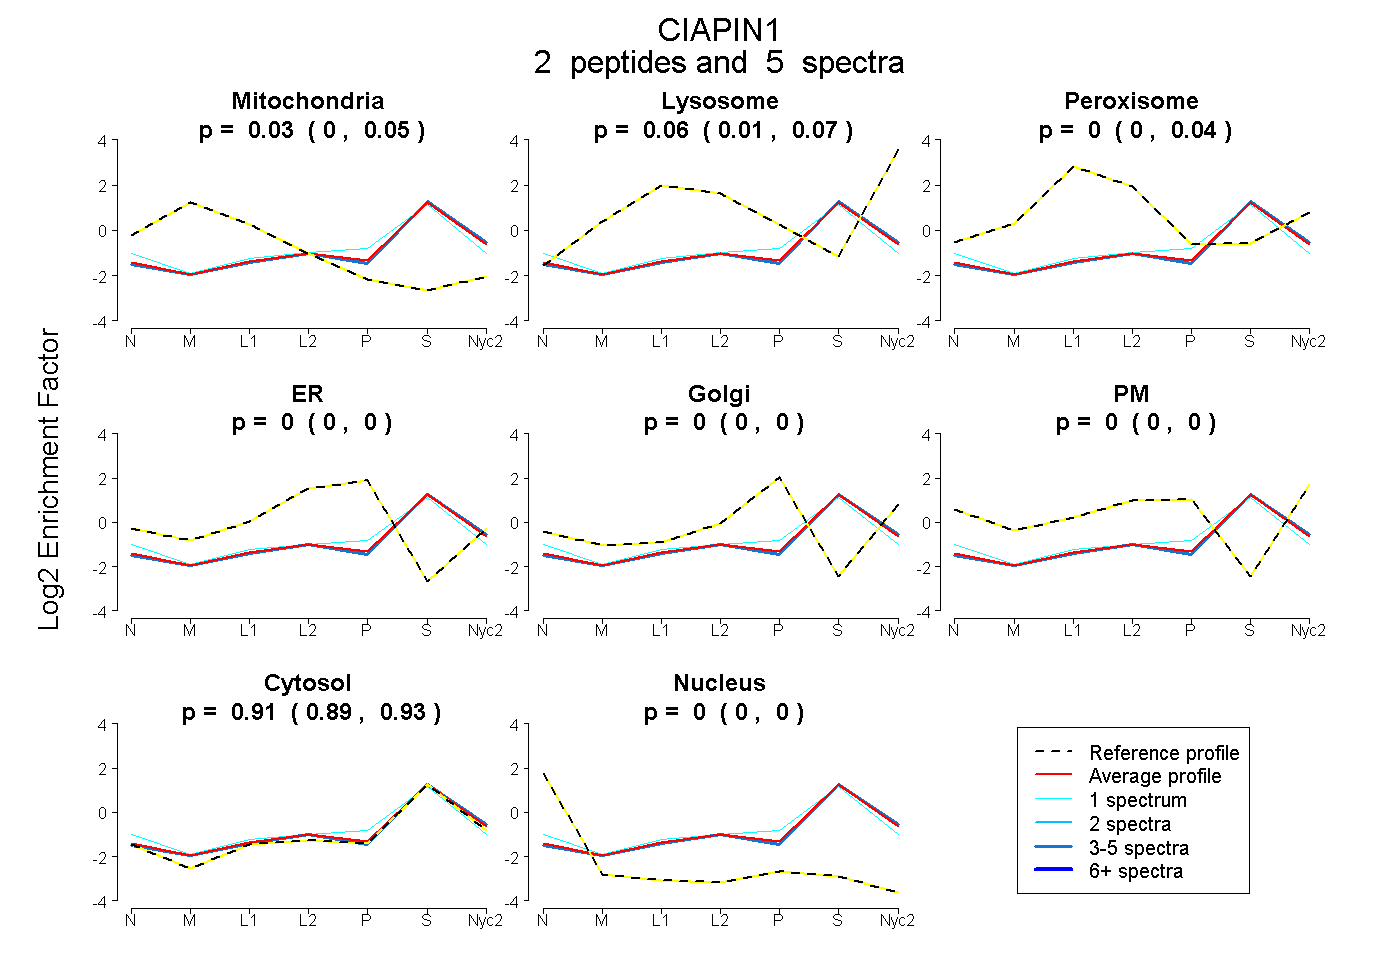
0.000 | 0.047
0.007 | 0.075
0.000 | 0.043
0.000 | 0.000
0.000 | 0.000
0.000 | 0.000
0.890 | 0.935
0.000 | 0.000
| Plot | Mito | Lyso | Perox | ER | Golgi | PM | Cytosol | Nucleus | |||||
| Expt A |
2 peptides |
5 spectra |
|
0.029 0.000 | 0.047 |
0.055 0.007 | 0.075 |
0.001 0.000 | 0.043 |
0.000 0.000 | 0.000 |
0.000 0.000 | 0.000 |
0.000 0.000 | 0.000 |
0.914 0.890 | 0.935 |
0.000 0.000 | 0.000 |
| 1 spectrum, NCTCGLAEELEK | 0.028 | 0.000 | 0.018 | 0.091 | 0.000 | 0.000 | 0.862 | 0.000 | ||
| 4 spectra, ILRPGGCLFLK | 0.018 | 0.060 | 0.000 | 0.000 | 0.000 | 0.000 | 0.922 | 0.000 |
| Plot | Mito | Lyso or Perox | ER | Golgi | PM | Cytosol | Nucleus | ||||||
| Expt B |
1 peptide |
2 spectra |
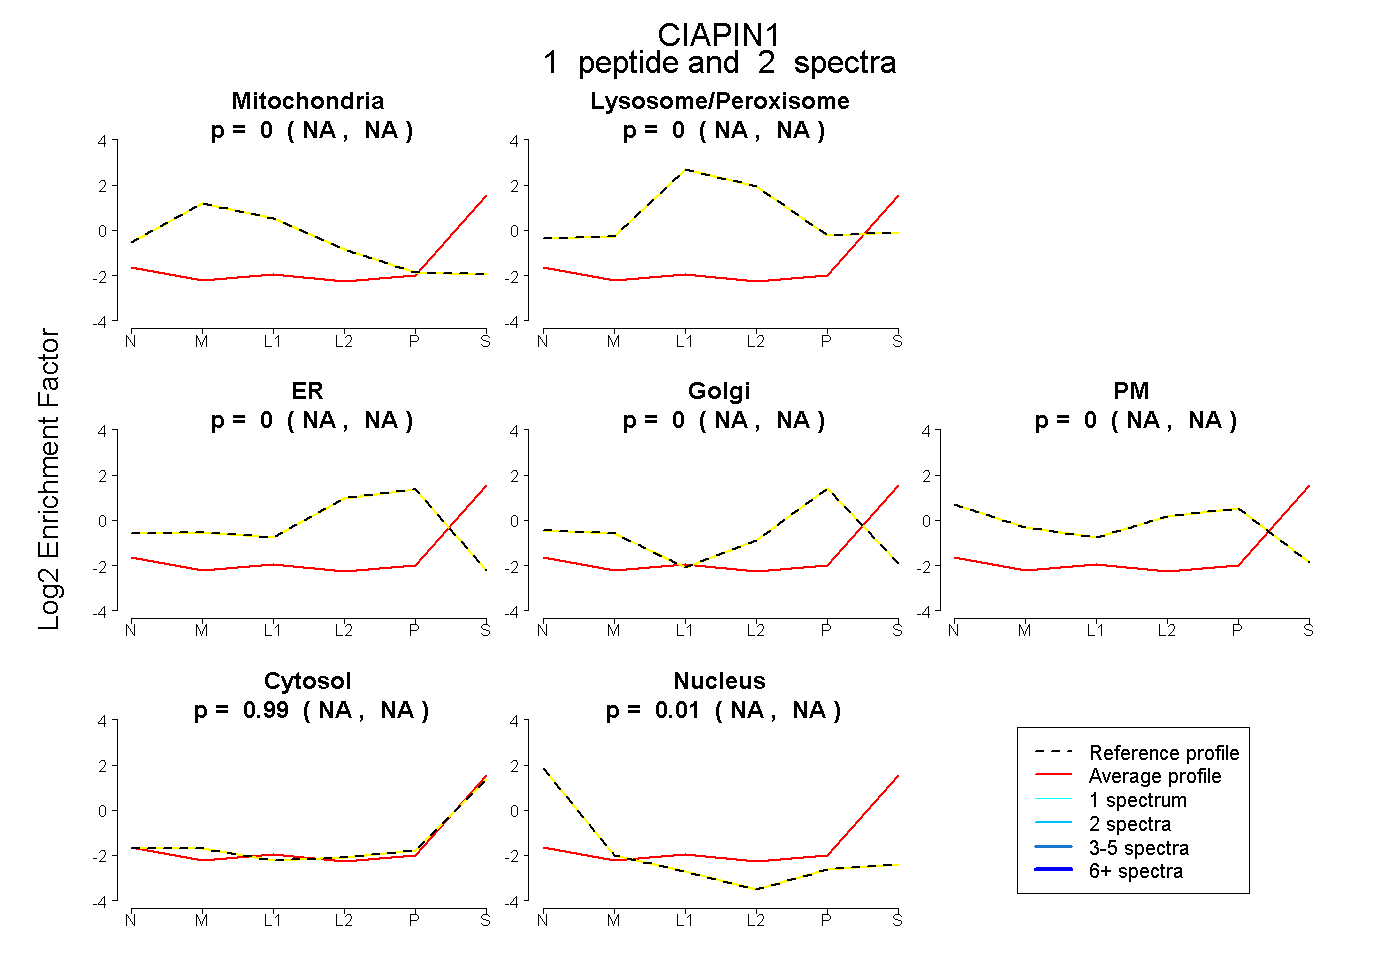 |
0.000 NA | NA |
0.000 NA | NA |
0.000 NA | NA |
0.000 NA | NA |
0.000 NA | NA |
0.995 NA | NA |
0.005 NA | NA |
|||
| Plot | Lyso | Other | |||||||||||
| Expt C |
4 peptides |
12 spectra |
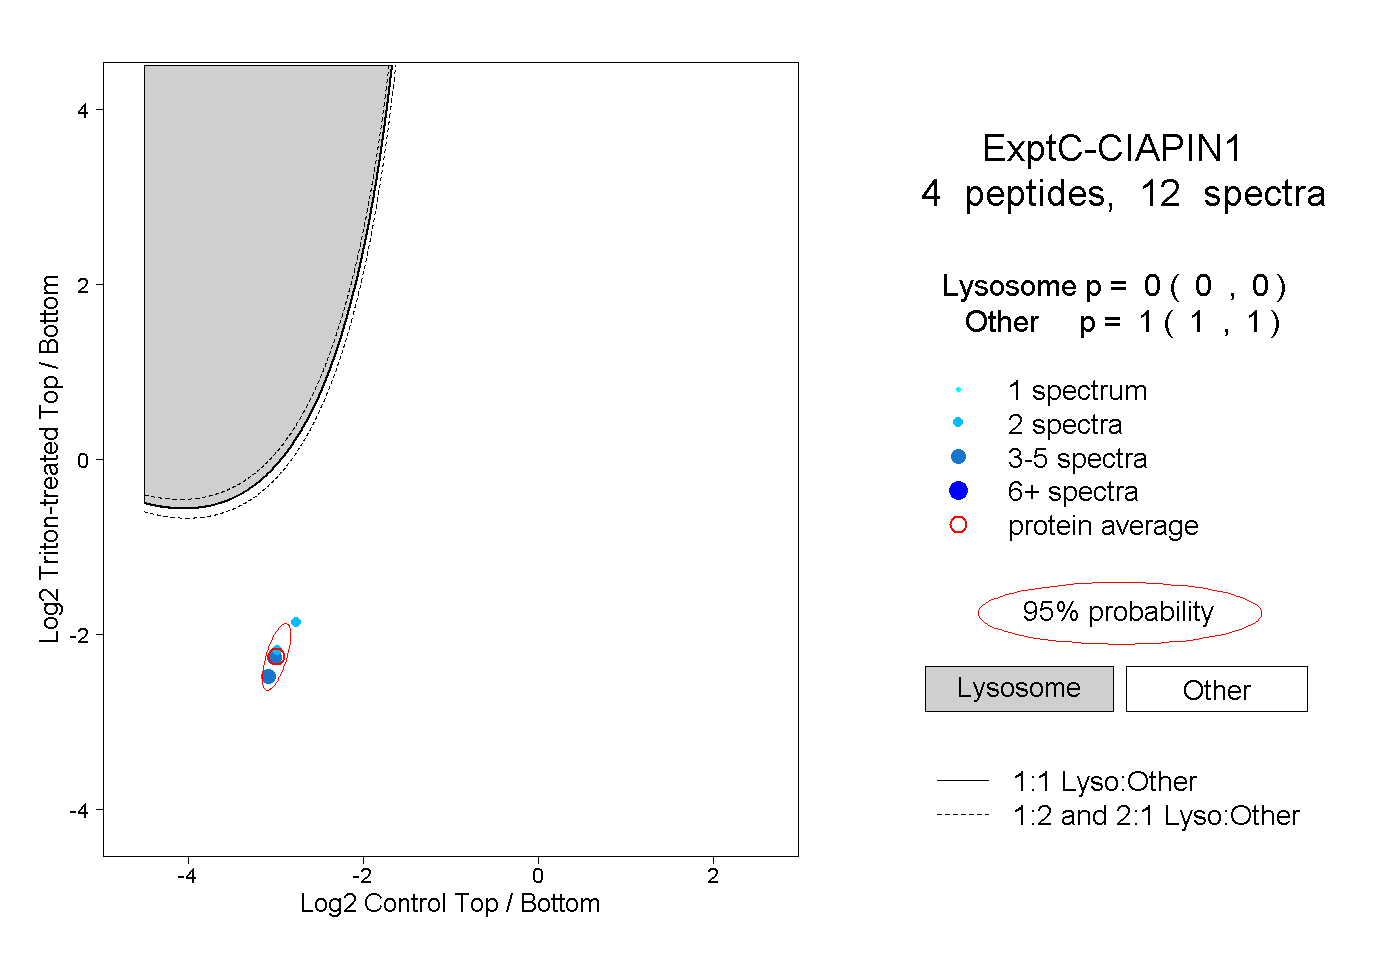 |
0.000 0.000 | 0.000 |
1.000 1.000 | 1.000 |