 8
8peptides
spectra
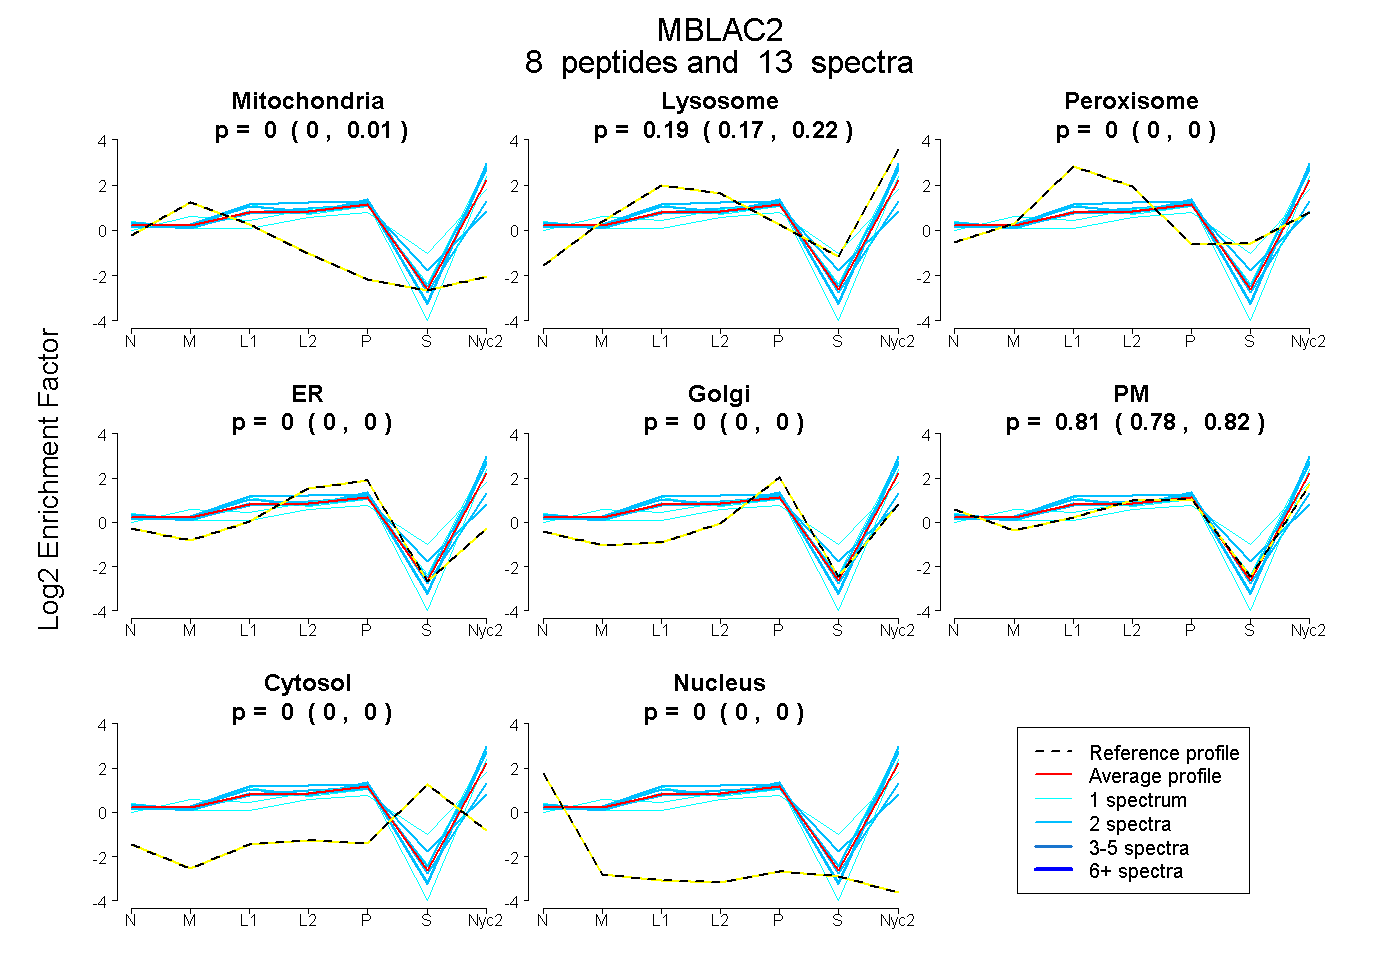
0.000 | 0.015
0.168 | 0.216
0.000 | 0.000
0.000 | 0.000
0.000 | 0.000
0.778 | 0.820
0.000 | 0.000
0.000 | 0.000
5peptides
spectra
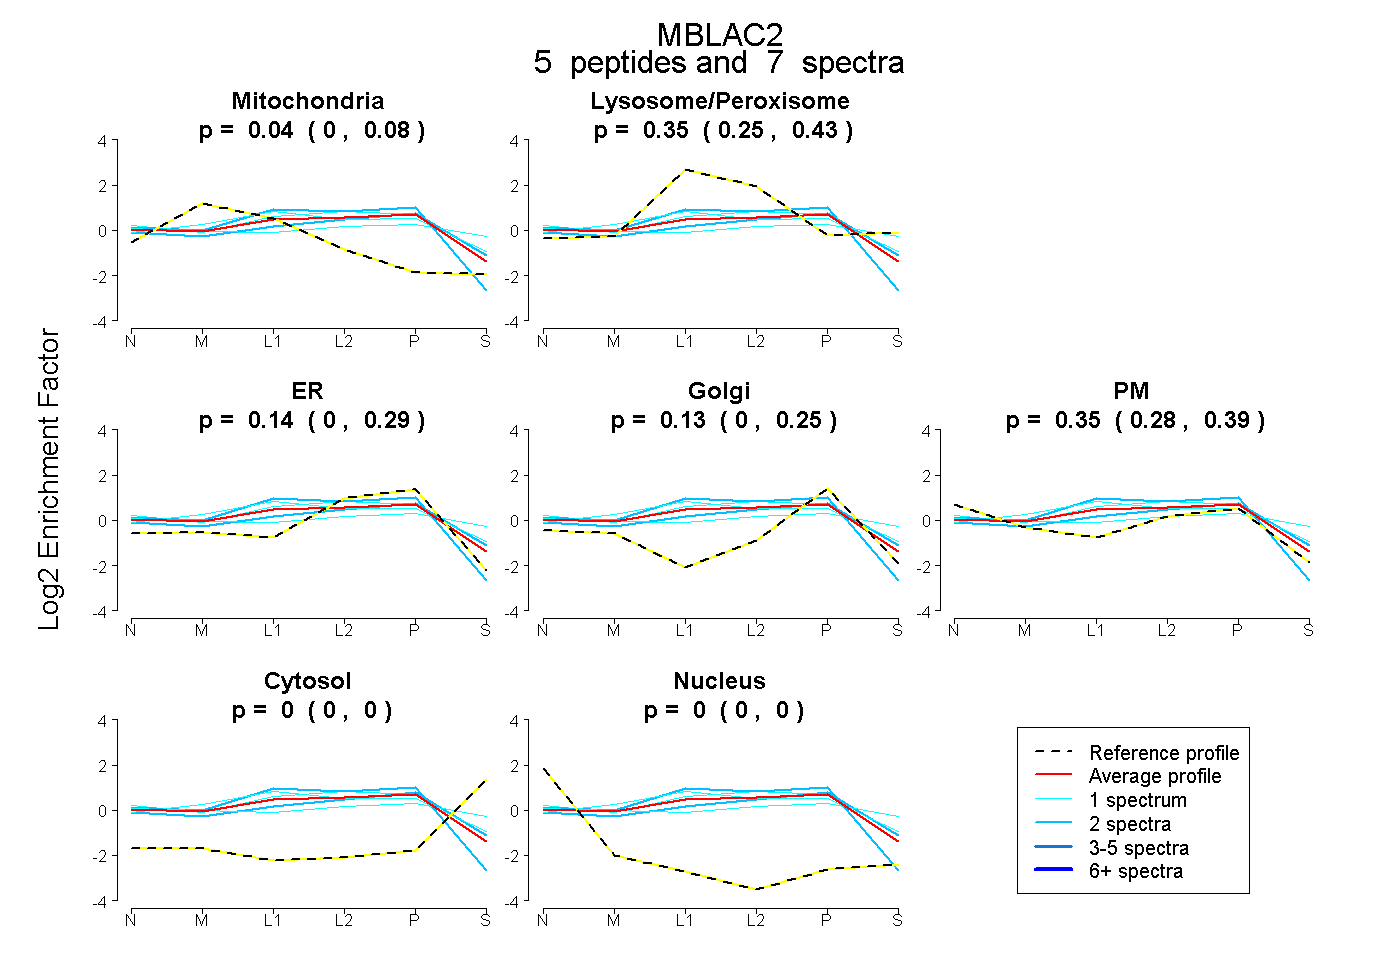
0.000 | 0.085
0.246 | 0.430
0.000 | 0.286
0.000 | 0.253
0.283 | 0.389
0.000 | 0.000
0.000 | 0.000
10peptides
spectra
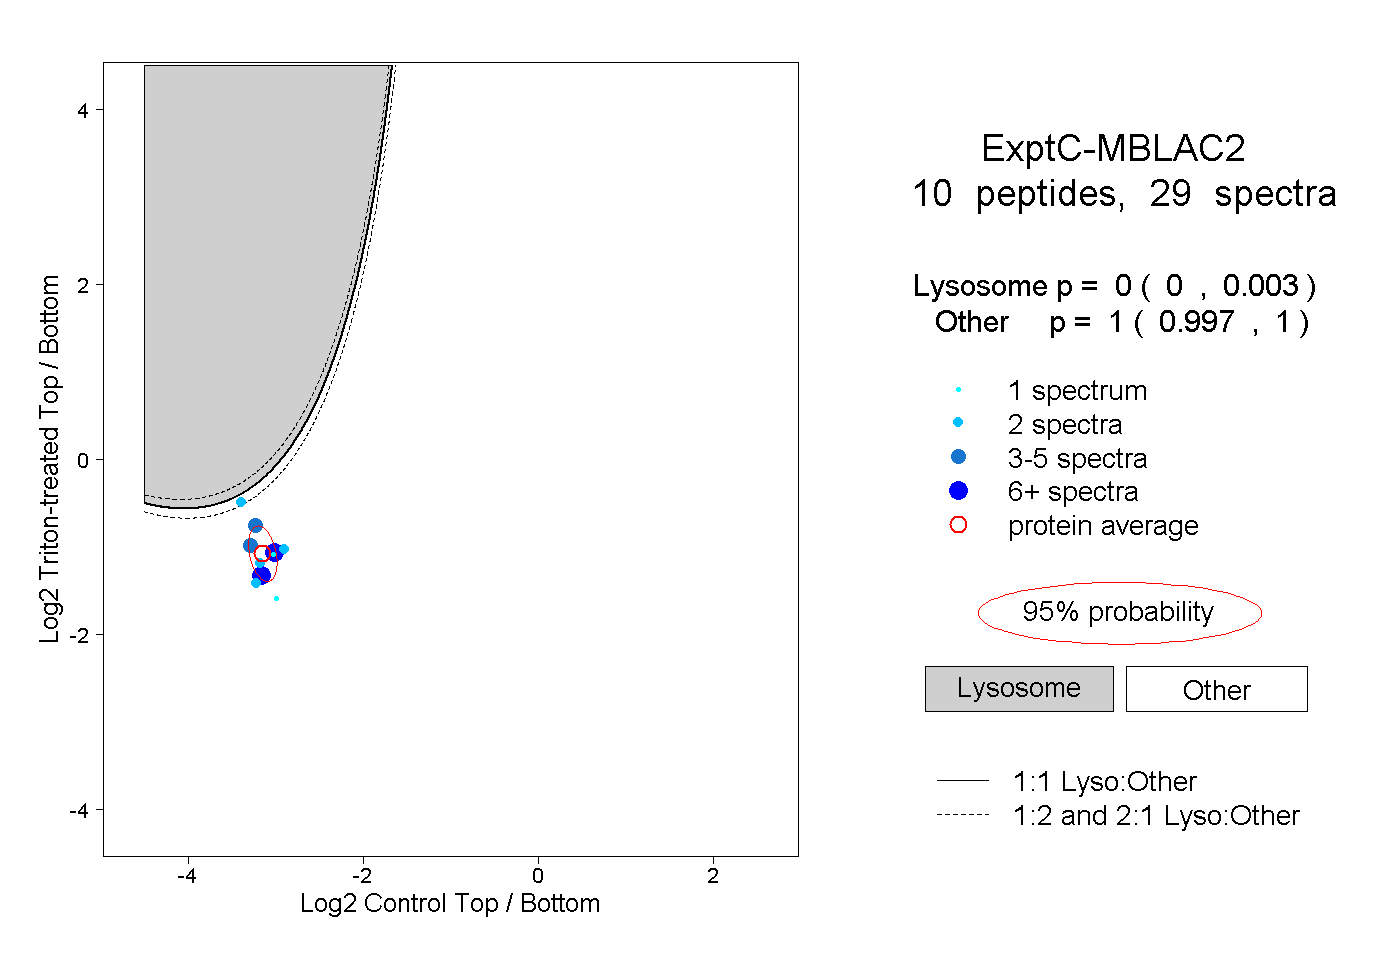
0.000 | 0.003
0.997 | 1.000
1peptide
spectra
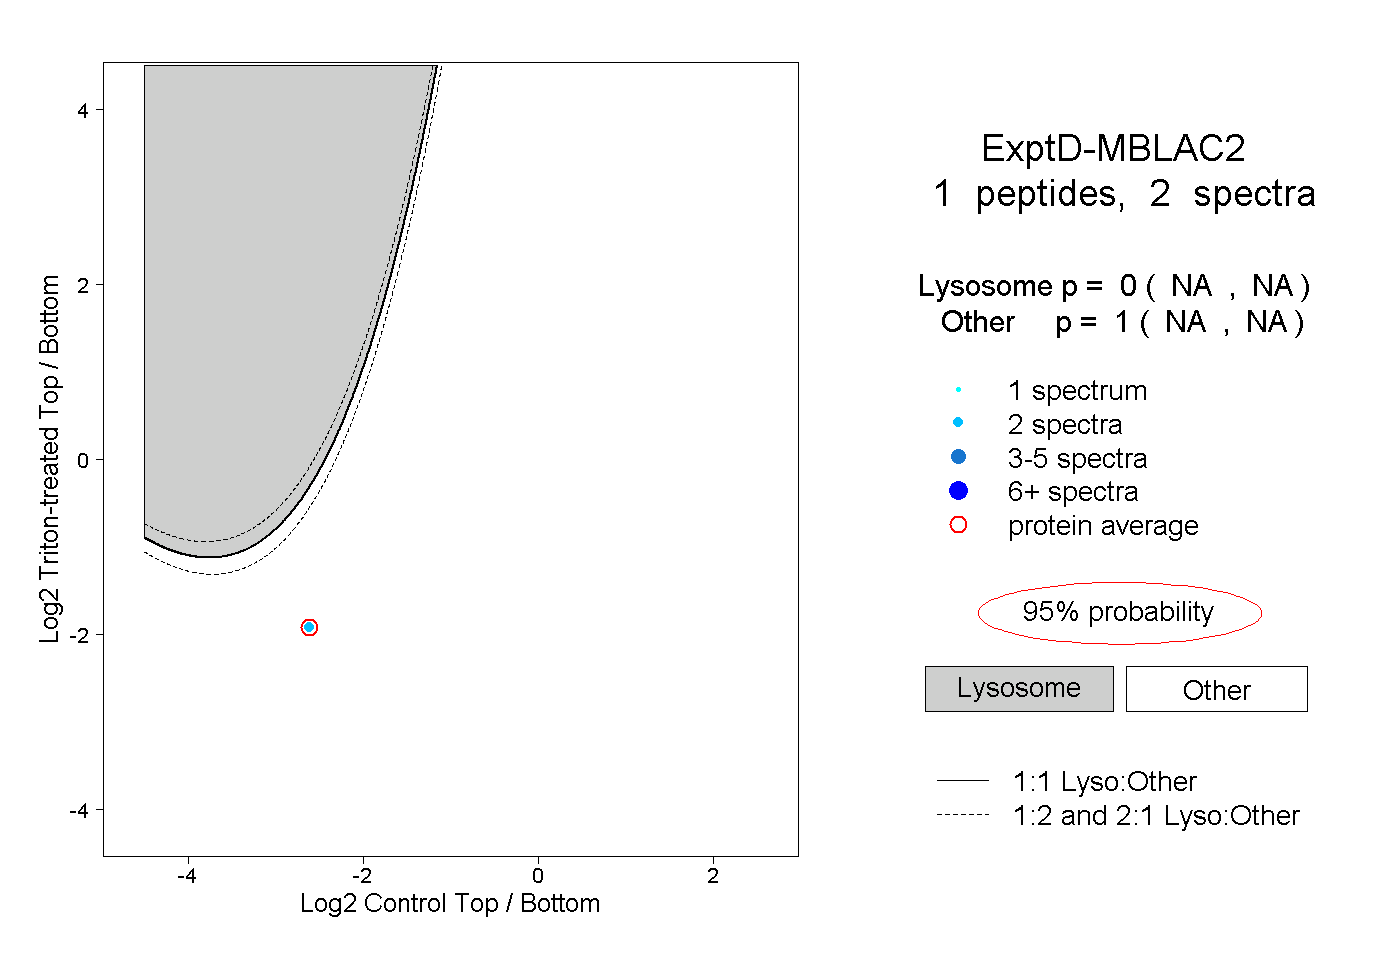
NA | NA
NA | NA