 8
8peptides
spectra
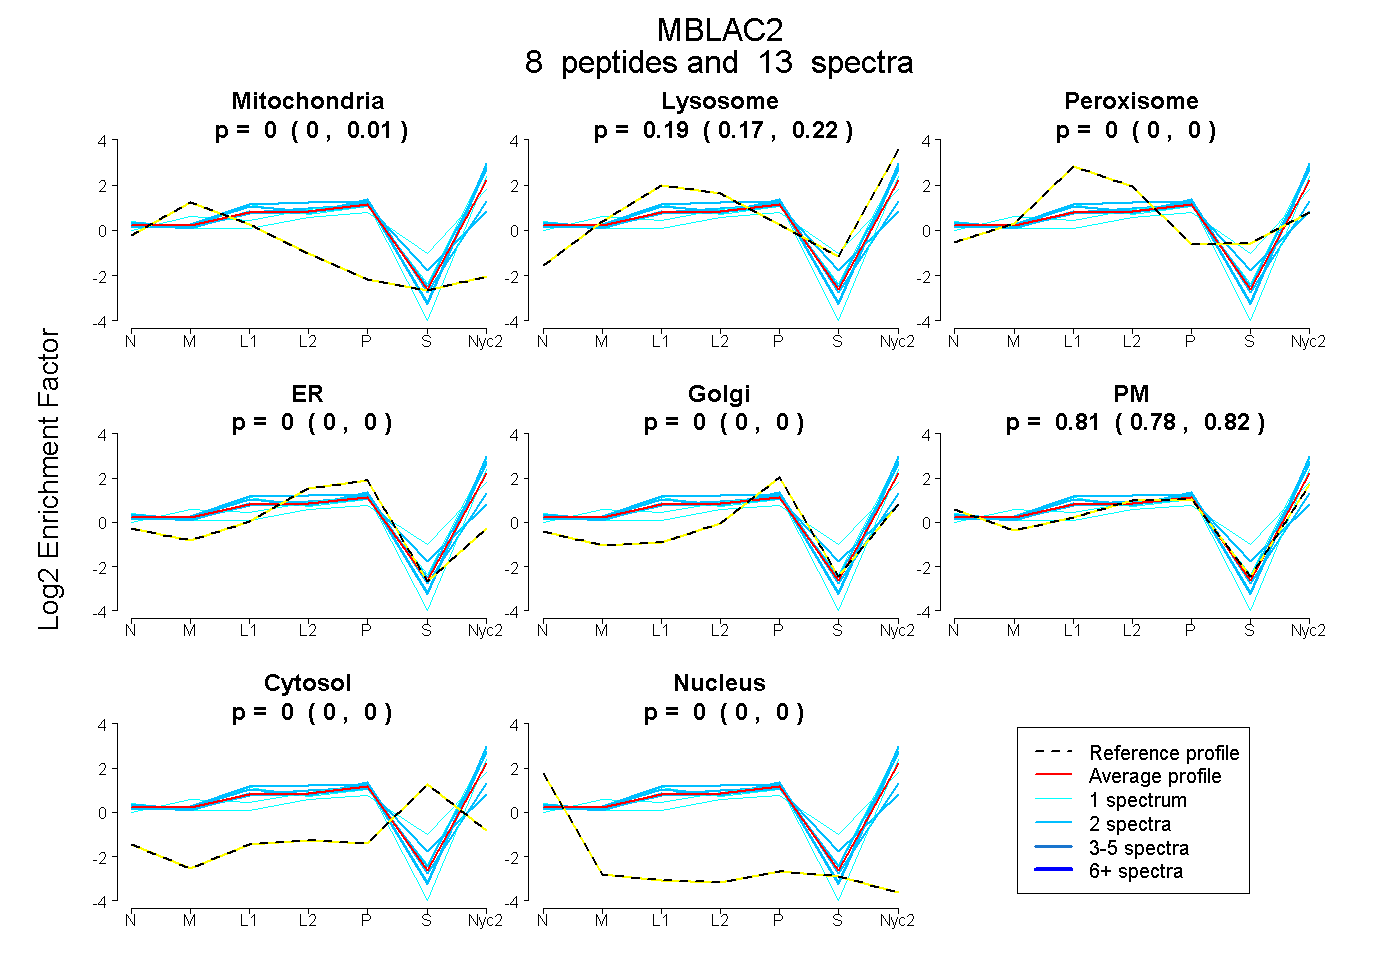
0.000 | 0.015
0.168 | 0.216
0.000 | 0.000
0.000 | 0.000
0.000 | 0.000
0.778 | 0.820
0.000 | 0.000
0.000 | 0.000
| Plot | Mito | Lyso | Perox | ER | Golgi | PM | Cytosol | Nucleus | |||||
| Expt A |
8 peptides |
13 spectra |
|
0.000 0.000 | 0.015 |
0.193 0.168 | 0.216 |
0.000 0.000 | 0.000 |
0.000 0.000 | 0.000 |
0.000 0.000 | 0.000 |
0.806 0.778 | 0.820 |
0.000 0.000 | 0.000 |
0.000 0.000 | 0.000 |
| 2 spectra, ISDYVGTCER | 0.046 | 0.000 | 0.277 | 0.076 | 0.200 | 0.401 | 0.000 | 0.000 | ||
| 2 spectra, LASNYISK | 0.000 | 0.248 | 0.000 | 0.000 | 0.000 | 0.752 | 0.000 | 0.000 | ||
| 2 spectra, ANIWLVR | 0.057 | 0.105 | 0.000 | 0.199 | 0.000 | 0.638 | 0.000 | 0.000 | ||
| 2 spectra, VLPGHFNTFGAER | 0.000 | 0.314 | 0.000 | 0.000 | 0.000 | 0.686 | 0.000 | 0.000 | ||
| 1 spectrum, AGICHK | 0.000 | 0.197 | 0.000 | 0.000 | 0.000 | 0.650 | 0.153 | 0.000 | ||
| 2 spectra, SLASLALR | 0.000 | 0.230 | 0.000 | 0.000 | 0.000 | 0.770 | 0.000 | 0.000 | ||
| 1 spectrum, GDNFETVTWLSDSEVVR | 0.000 | 0.307 | 0.000 | 0.000 | 0.000 | 0.693 | 0.000 | 0.000 | ||
| 1 spectrum, LIELVDR | 0.000 | 0.107 | 0.000 | 0.000 | 0.000 | 0.893 | 0.000 | 0.000 |
| Plot | Mito | Lyso or Perox | ER | Golgi | PM | Cytosol | Nucleus | ||||||
| Expt B |
5 peptides |
7 spectra |
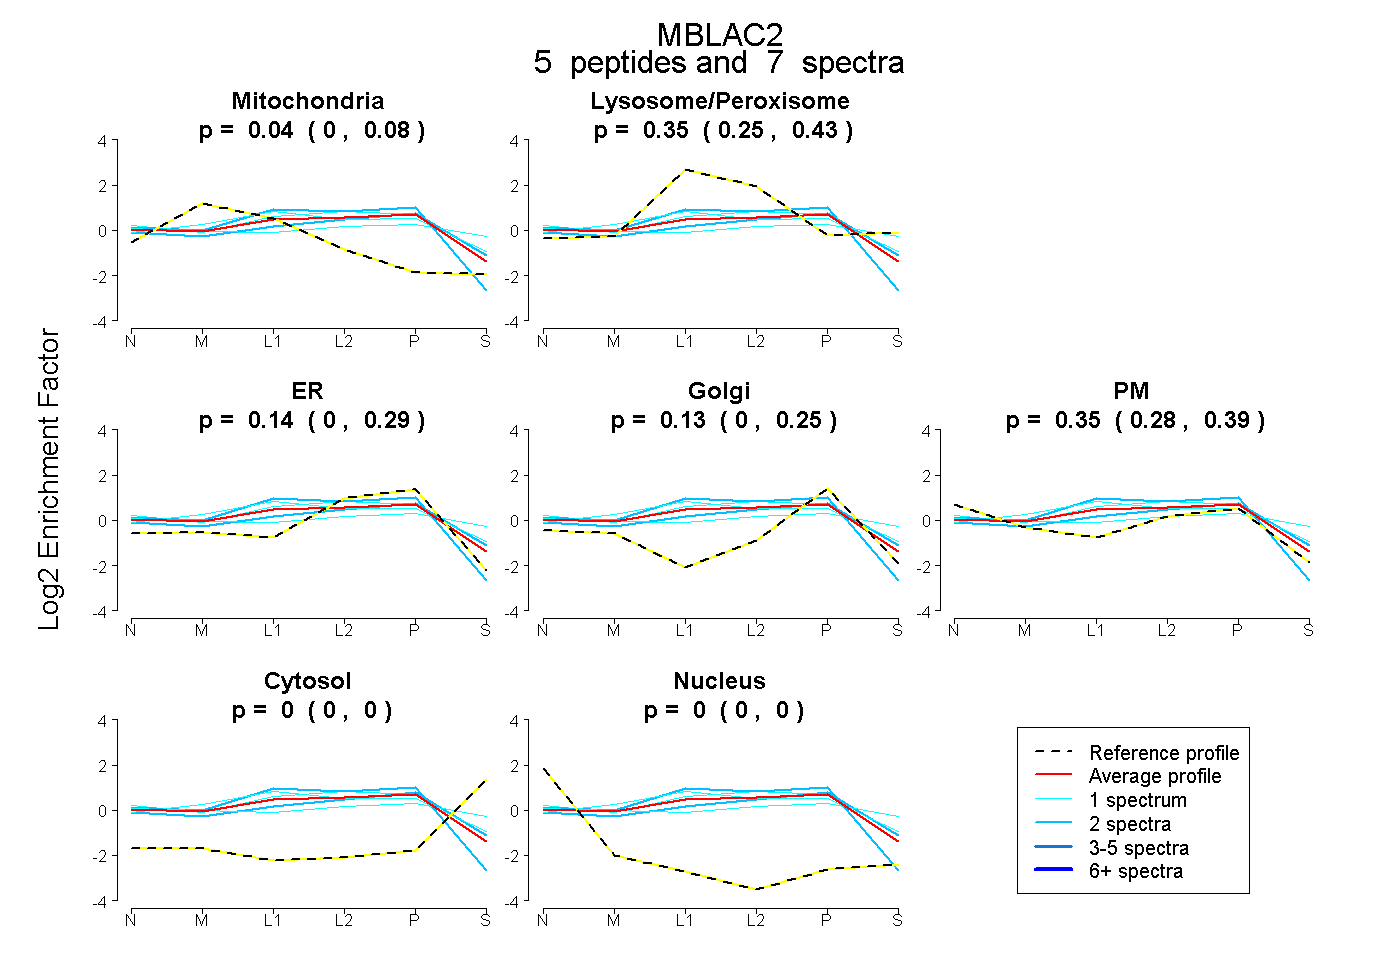 |
0.038 0.000 | 0.085 |
0.345 0.246 | 0.430 |
0.137 0.000 | 0.286 |
0.128 0.000 | 0.253 |
0.352 0.283 | 0.389 |
0.000 0.000 | 0.000 |
0.000 0.000 | 0.000 |
|||
| Plot | Lyso | Other | |||||||||||
| Expt C |
10 peptides |
29 spectra |
 |
0.000 0.000 | 0.003 |
1.000 0.997 | 1.000 |
||||||||
| Plot | Lyso | Other | |||||||||||
| Expt D |
1 peptide |
2 spectra |
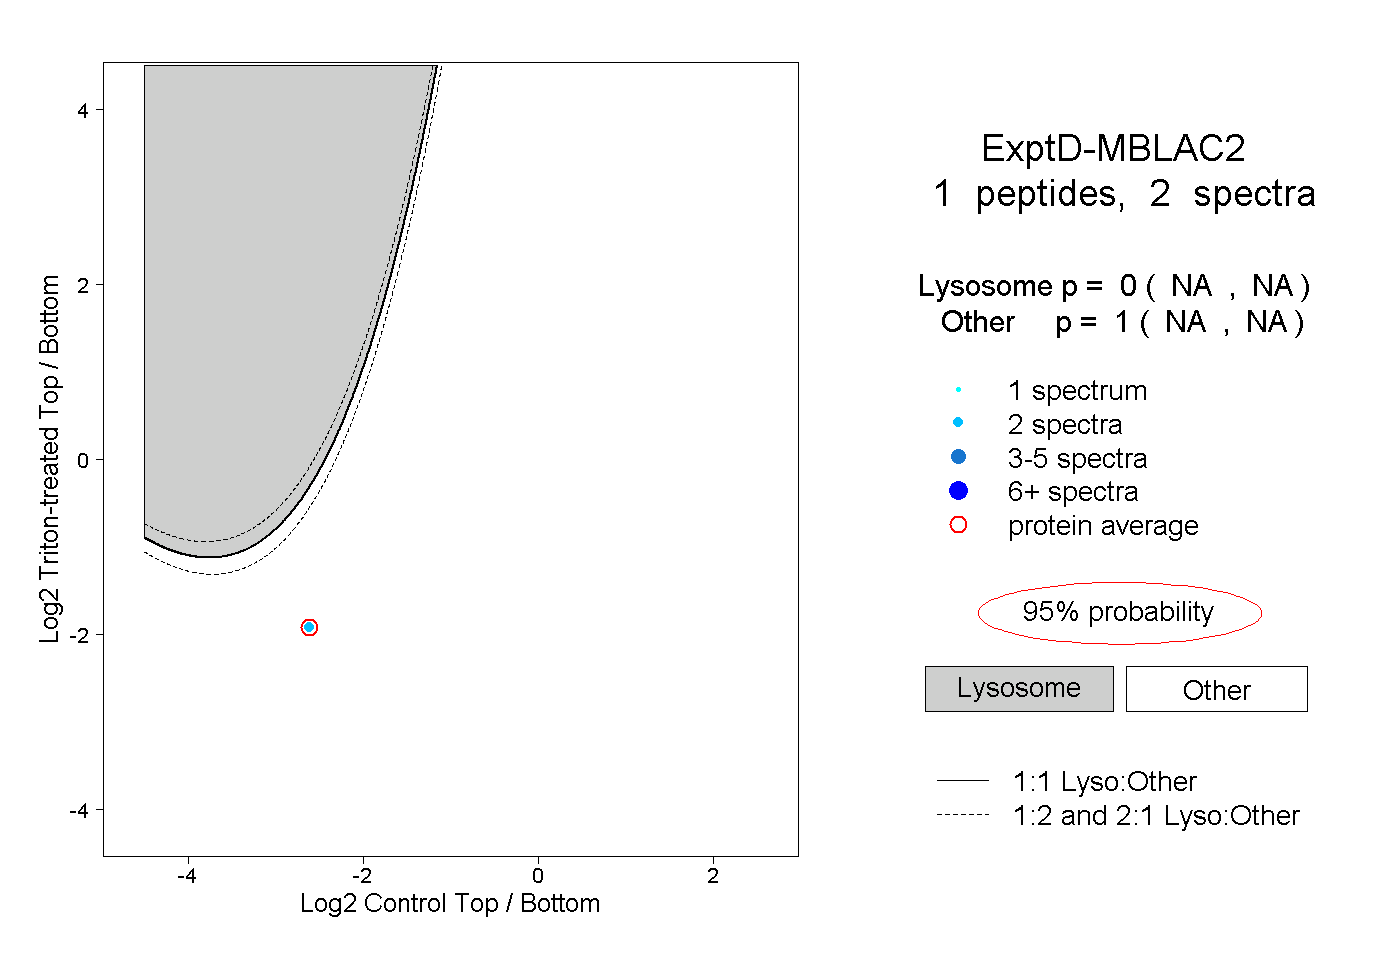 |
0.000 NA | NA |
1.000 NA | NA |