 8
8peptides
spectra
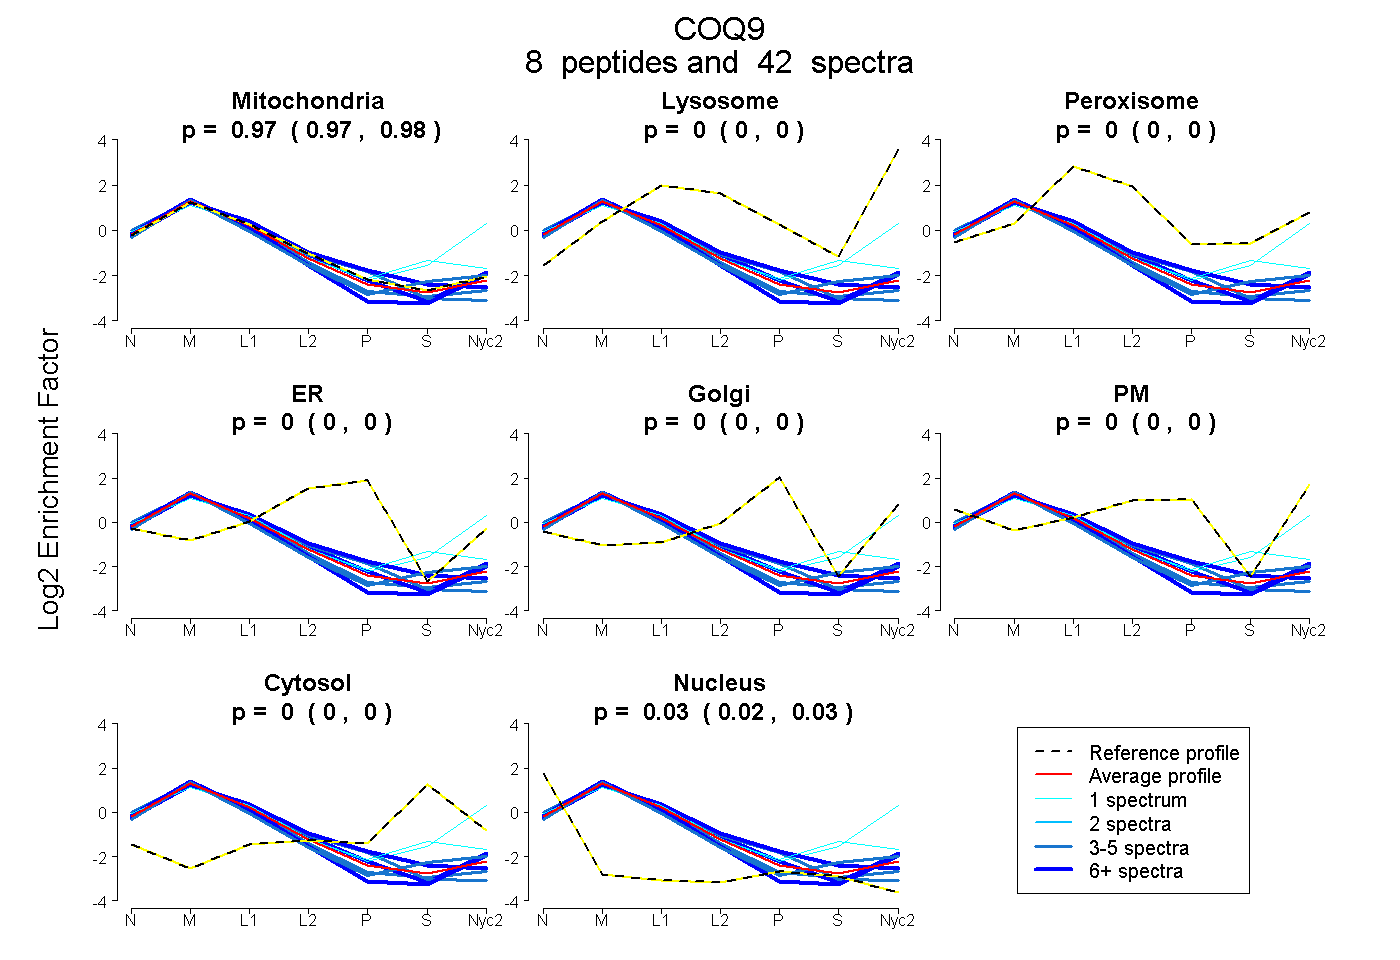
0.969 | 0.976
0.000 | 0.000
0.000 | 0.000
0.000 | 0.000
0.000 | 0.000
0.000 | 0.000
0.000 | 0.000
0.024 | 0.031
3peptides
spectra
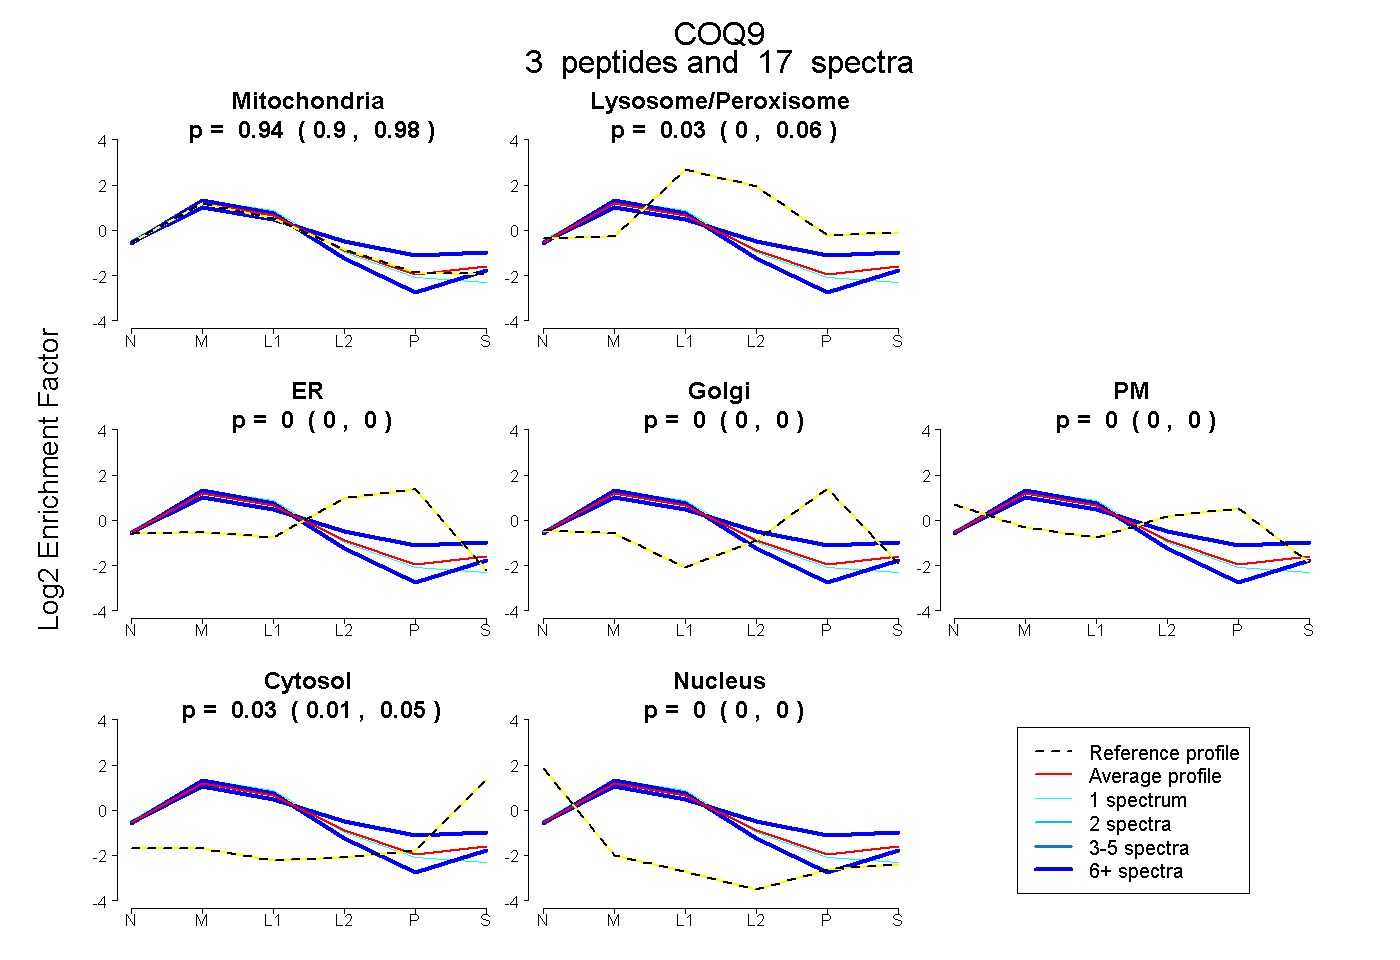
0.901 | 0.975
0.000 | 0.055
0.000 | 0.000
0.000 | 0.000
0.000 | 0.000
0.008 | 0.047
0.000 | 0.000
6peptides
spectra
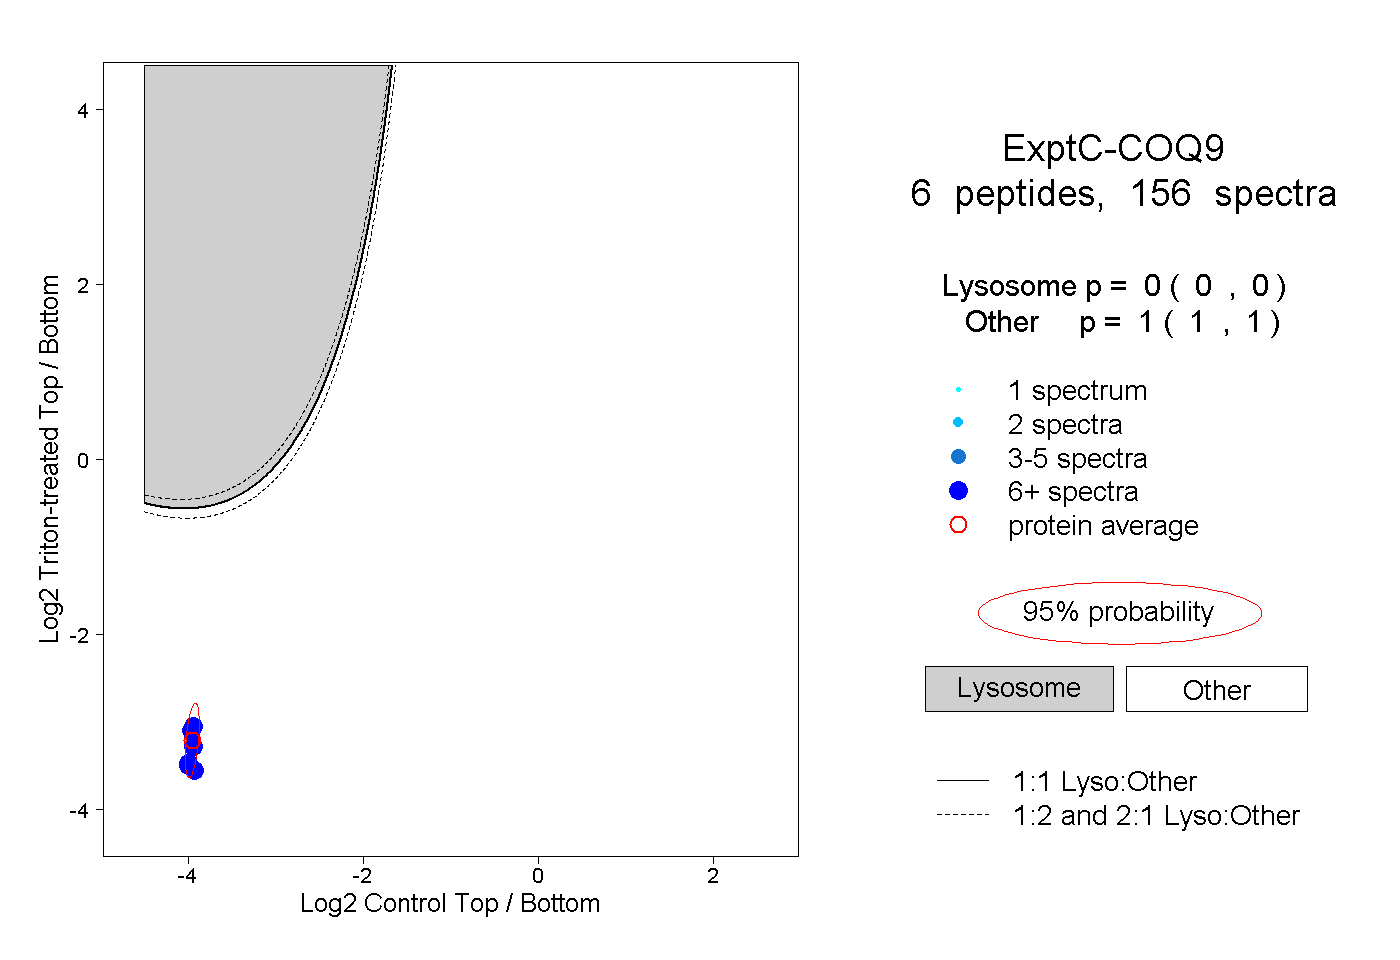
0.000 | 0.000
1.000 | 1.000
5peptides
spectra
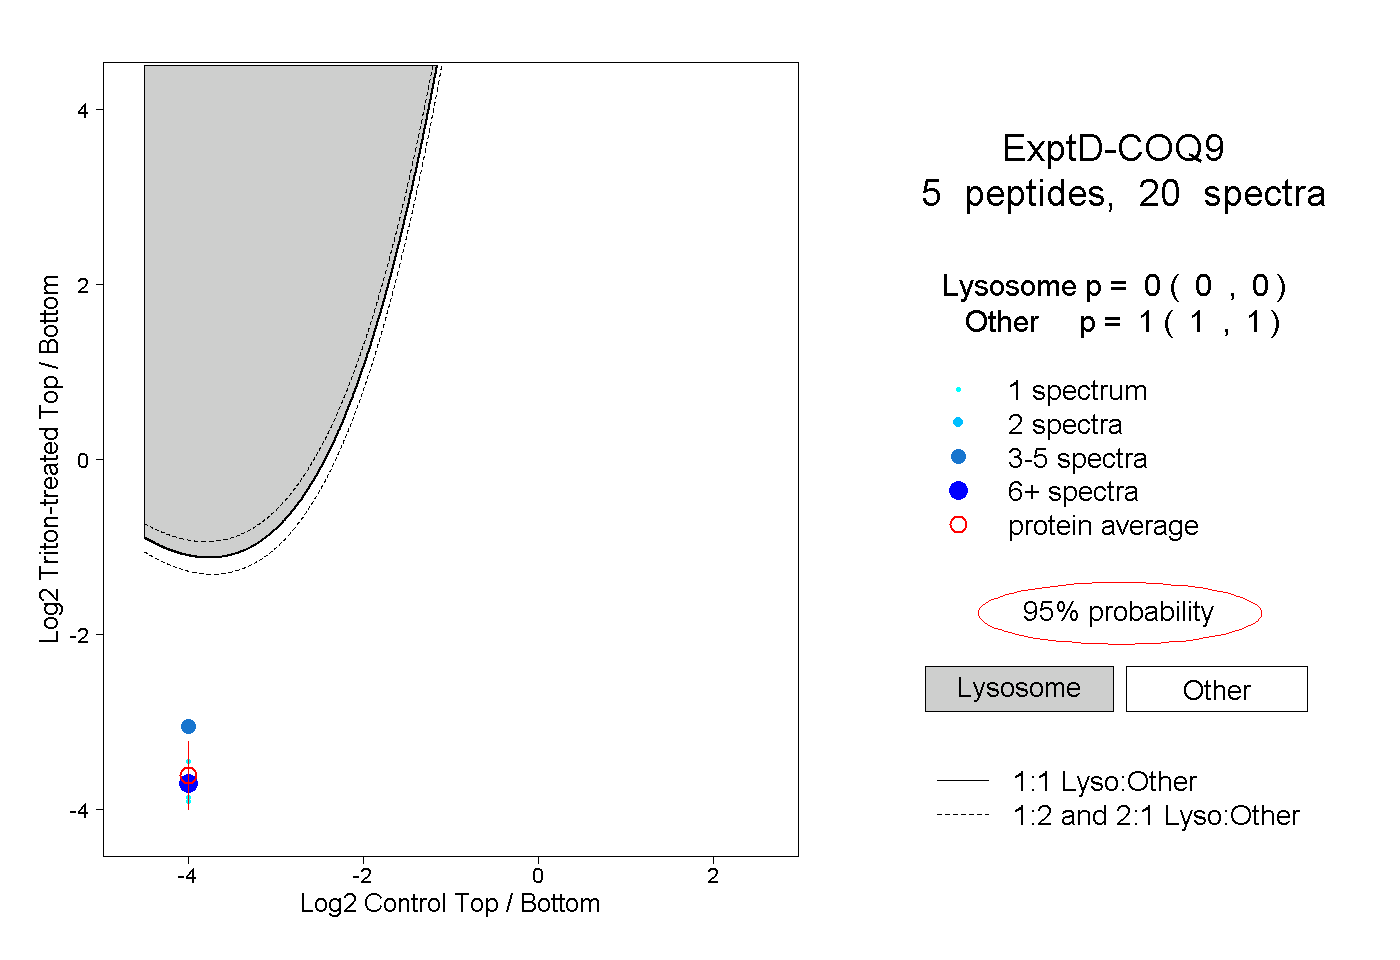
0.000 | 0.000
1.000 | 1.000