 8
8peptides
spectra
0.969 | 0.976
0.000 | 0.000
0.000 | 0.000
0.000 | 0.000
0.000 | 0.000
0.000 | 0.000
0.000 | 0.000
0.024 | 0.031
| Plot | Mito | Lyso | Perox | ER | Golgi | PM | Cytosol | Nucleus | |||||
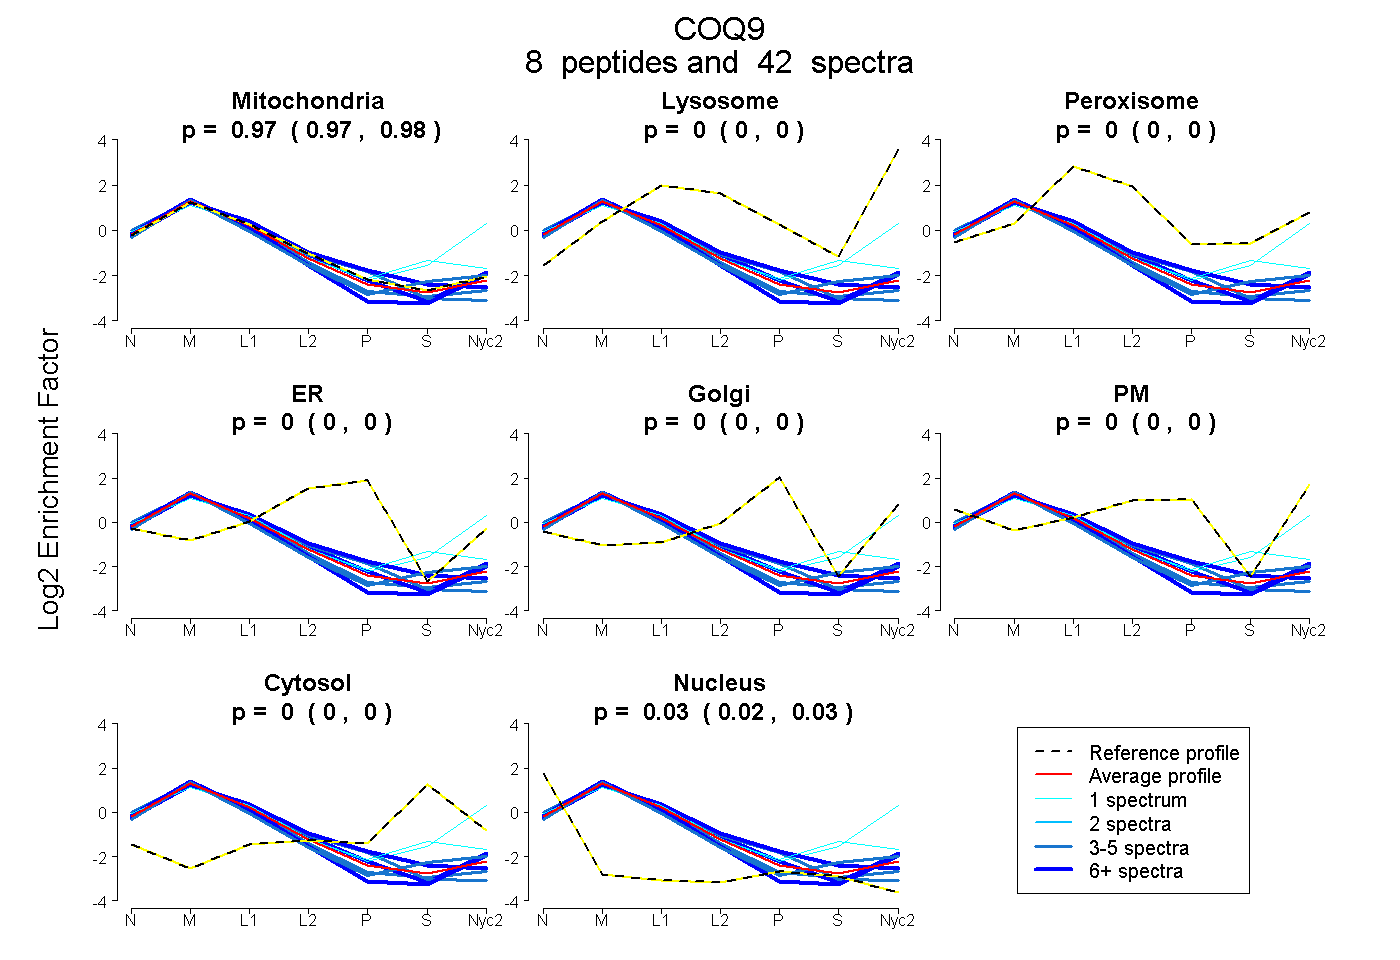
| Expt A |
8 peptides |
42 spectra |
|
0.973 0.969 | 0.976 |
0.000 0.000 | 0.000 |
0.000 0.000 | 0.000 |
0.000 0.000 | 0.000 |
0.000 0.000 | 0.000 |
0.000 0.000 | 0.000 |
0.000 0.000 | 0.000 |
0.027 0.024 | 0.031 |
| 4 spectra, DAVETR | 0.934 | 0.000 | 0.000 | 0.000 | 0.000 | 0.000 | 0.000 | 0.066 | ||
| 3 spectra, TDQFLR | 0.939 | 0.000 | 0.000 | 0.000 | 0.000 | 0.000 | 0.023 | 0.038 | ||
| 1 spectrum, STGEALVQGLMGAAVTLK | 0.798 | 0.000 | 0.055 | 0.000 | 0.000 | 0.000 | 0.147 | 0.000 | ||
| 1 spectrum, LVQLGQAEK | 0.651 | 0.259 | 0.000 | 0.000 | 0.000 | 0.000 | 0.078 | 0.012 | ||
| 10 spectra, NLTGLNQR | 0.956 | 0.000 | 0.000 | 0.000 | 0.000 | 0.000 | 0.000 | 0.044 | ||
| 7 spectra, INDAMNMGHTAK | 0.989 | 0.000 | 0.000 | 0.000 | 0.000 | 0.009 | 0.000 | 0.002 | ||
| 4 spectra, LNHVLEEEQK | 0.943 | 0.000 | 0.000 | 0.000 | 0.000 | 0.000 | 0.000 | 0.057 | ||
| 12 spectra, MLIPYIEHWPR | 0.959 | 0.000 | 0.000 | 0.031 | 0.000 | 0.000 | 0.005 | 0.005 |
| Plot | Mito | Lyso or Perox | ER | Golgi | PM | Cytosol | Nucleus | ||||||
| Expt B |
3 peptides |
17 spectra |
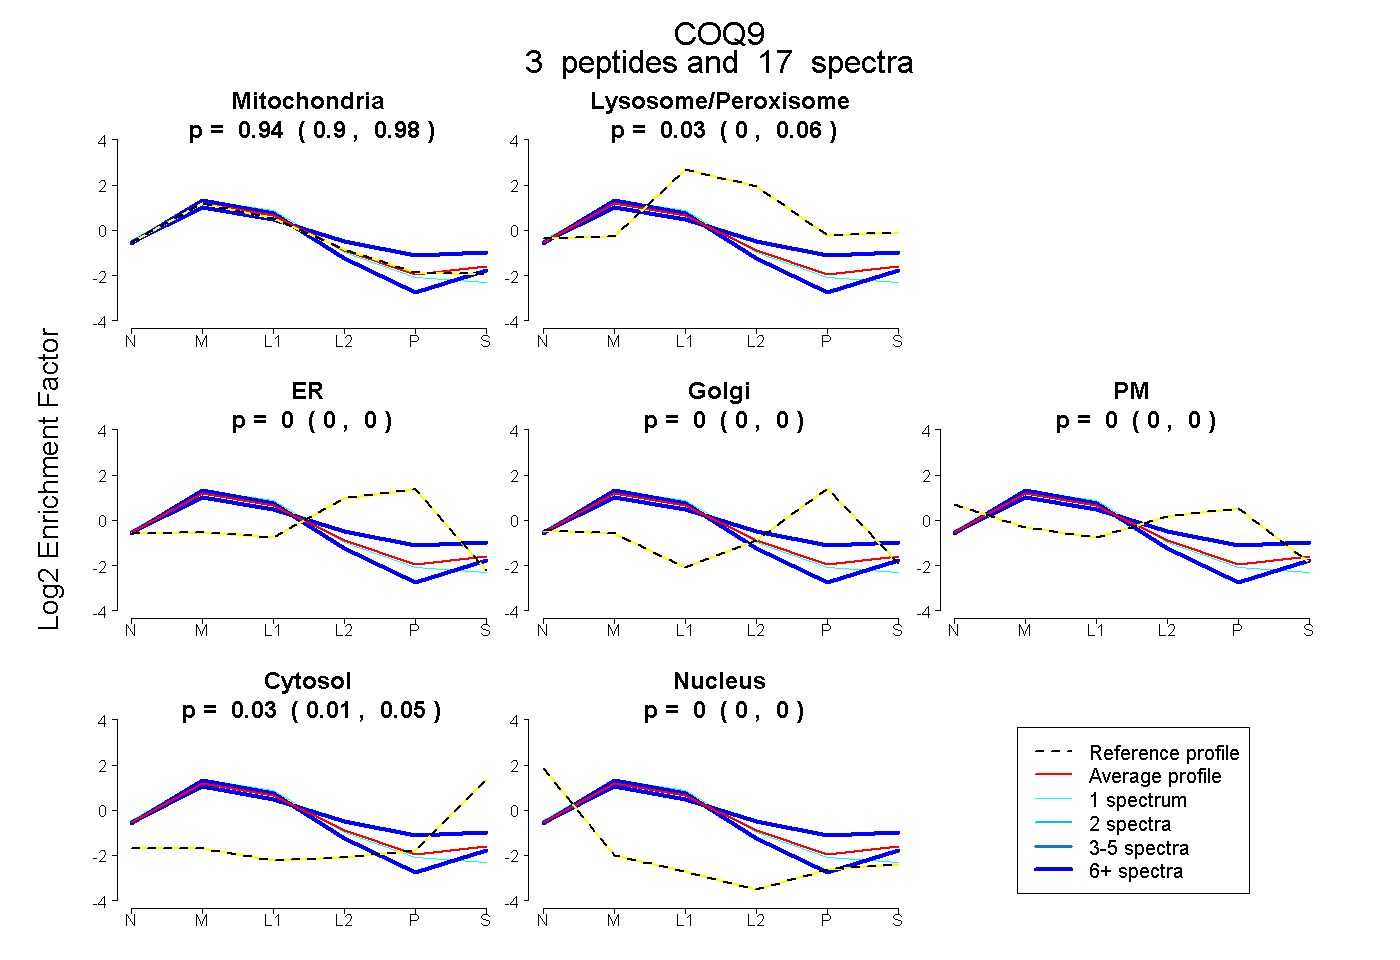 |
0.942 0.901 | 0.975 |
0.028 0.000 | 0.055 |
0.000 0.000 | 0.000 |
0.000 0.000 | 0.000 |
0.000 0.000 | 0.000 |
0.029 0.008 | 0.047 |
0.000 0.000 | 0.000 |
|||
| Plot | Lyso | Other | |||||||||||
| Expt C |
6 peptides |
156 spectra |
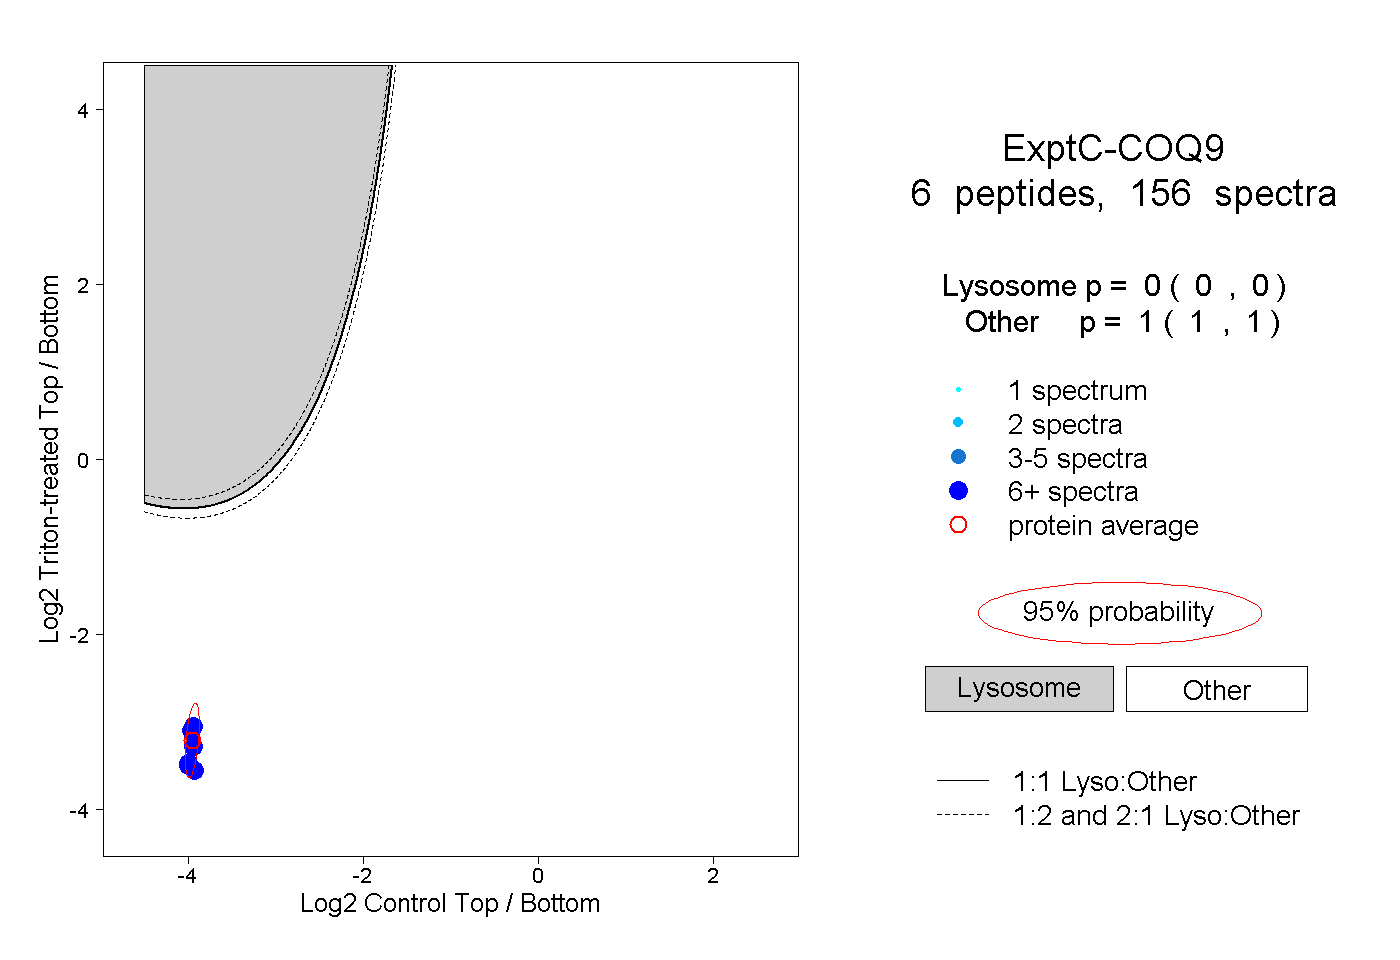 |
0.000 0.000 | 0.000 |
1.000 1.000 | 1.000 |
||||||||
| Plot | Lyso | Other | |||||||||||
| Expt D |
5 peptides |
20 spectra |
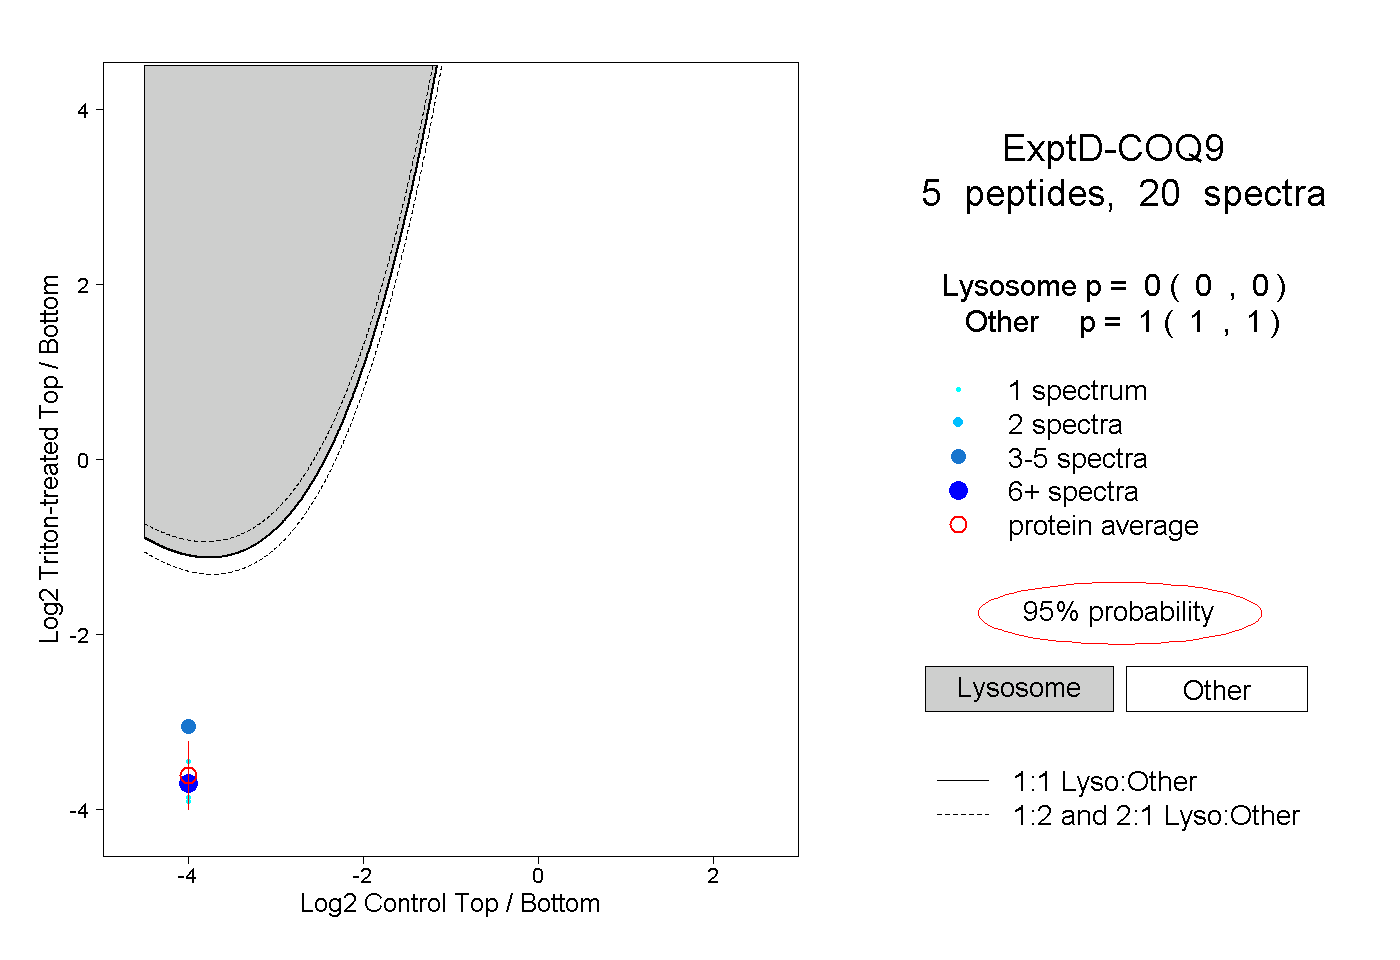 |
0.000 0.000 | 0.000 |
1.000 1.000 | 1.000 |