 10
10peptides
spectra
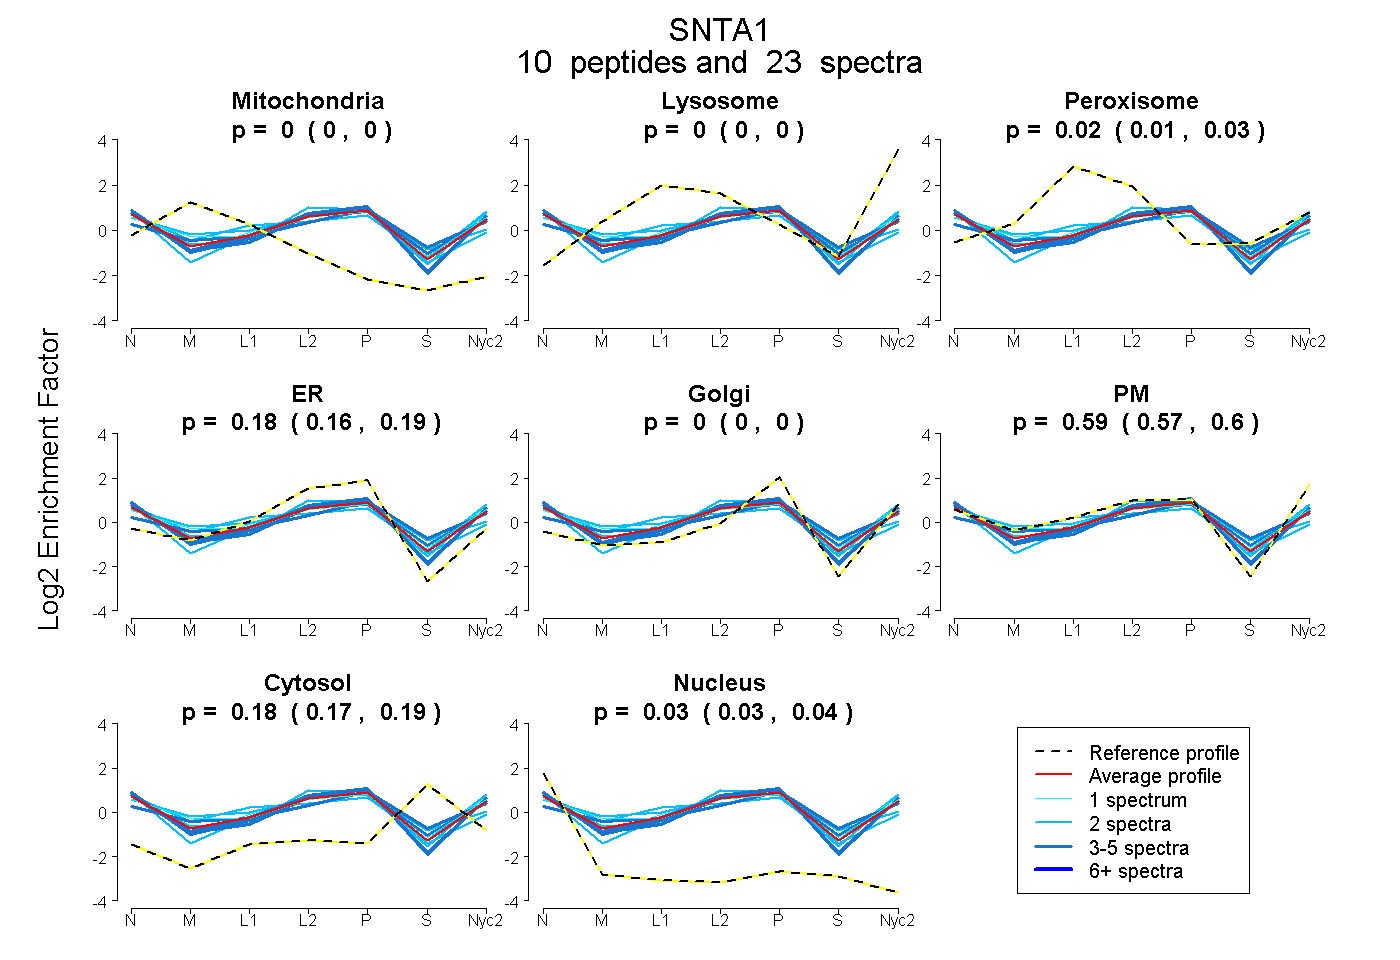
0.000 | 0.000
0.000 | 0.000
0.013 | 0.029
0.161 | 0.186
0.000 | 0.000
0.573 | 0.604
0.168 | 0.189
0.027 | 0.040
1peptide
spectra
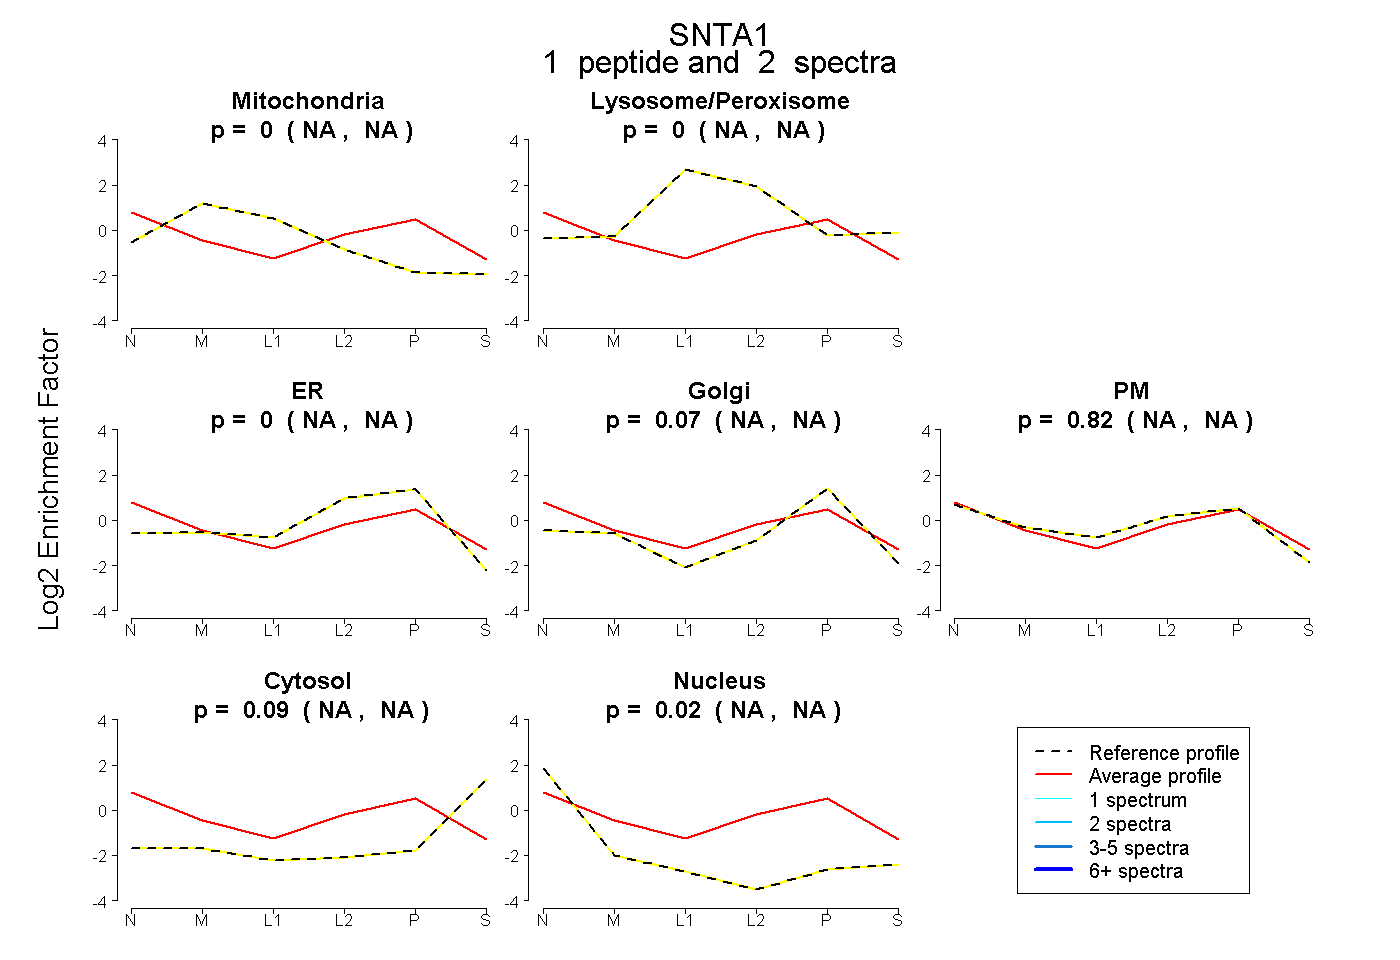
NA | NA
NA | NA
NA | NA
NA | NA
NA | NA
NA | NA
NA | NA
10peptides
spectra
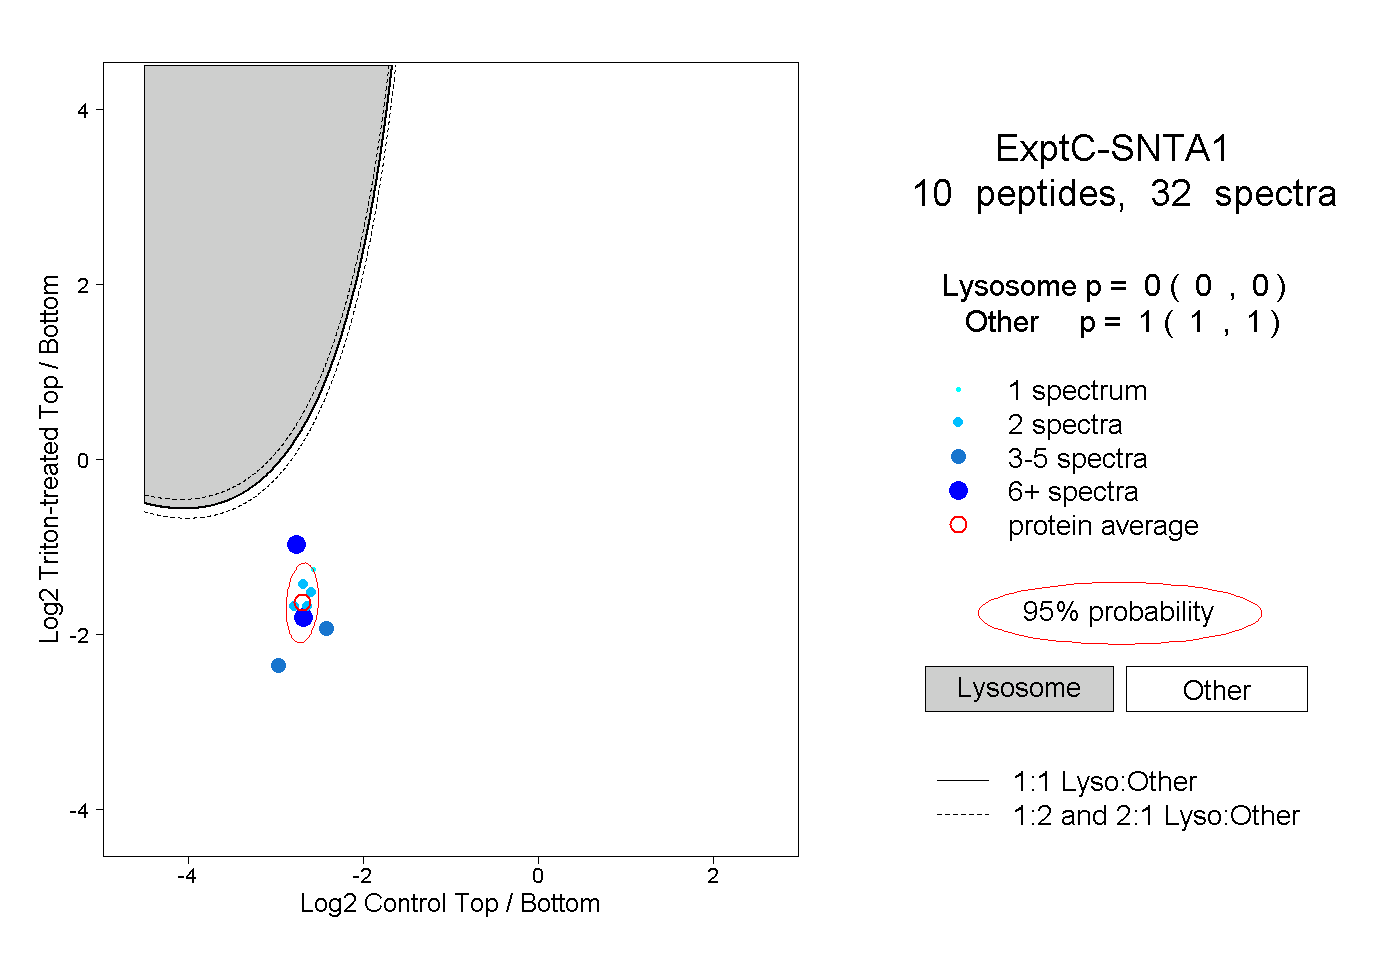
0.000 | 0.000
1.000 | 1.000
2peptides
spectra
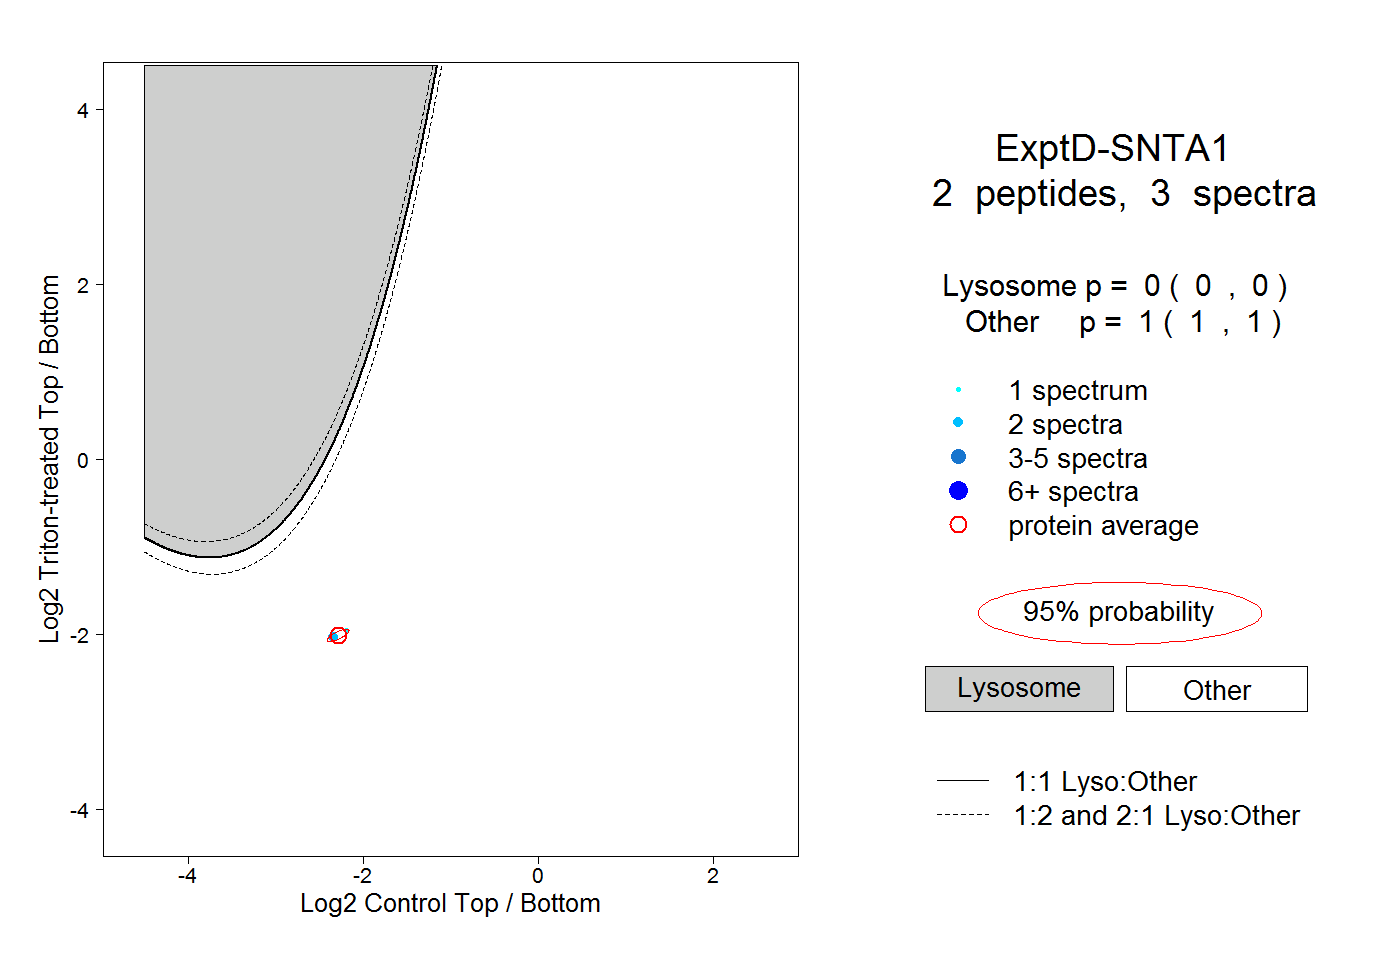
0.000 | 0.000
1.000 | 1.000