 12
12peptides
spectra
0.000 | 0.007
0.000 | 0.000
0.000 | 0.000
0.047 | 0.068
0.000 | 0.000
0.000 | 0.000
0.831 | 0.852
0.084 | 0.110
1peptide
spectrum
NA | NA
NA | NA
NA | NA
NA | NA
NA | NA
NA | NA
NA | NA
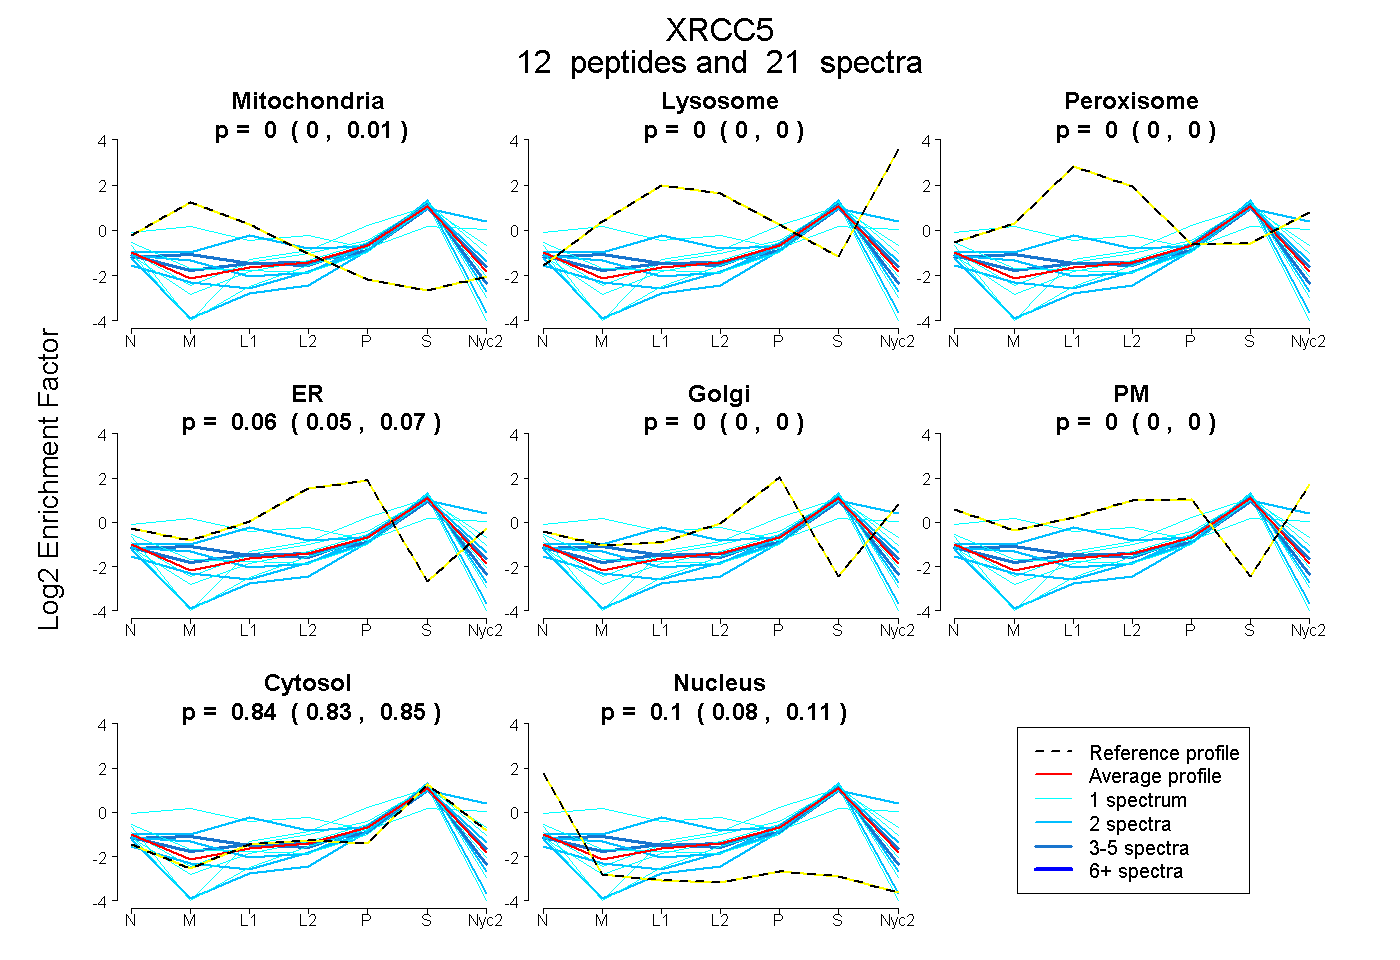
| Plot | Mito | Lyso | Perox | ER | Golgi | PM | Cytosol | Nucleus | |||||
| Expt A |
12 peptides |
21 spectra |
|
0.000 0.000 | 0.007 |
0.000 0.000 | 0.000 |
0.000 0.000 | 0.000 |
0.058 0.047 | 0.068 |
0.000 0.000 | 0.000 |
0.000 0.000 | 0.000 |
0.842 0.831 | 0.852 |
0.099 0.084 | 0.110 |
||
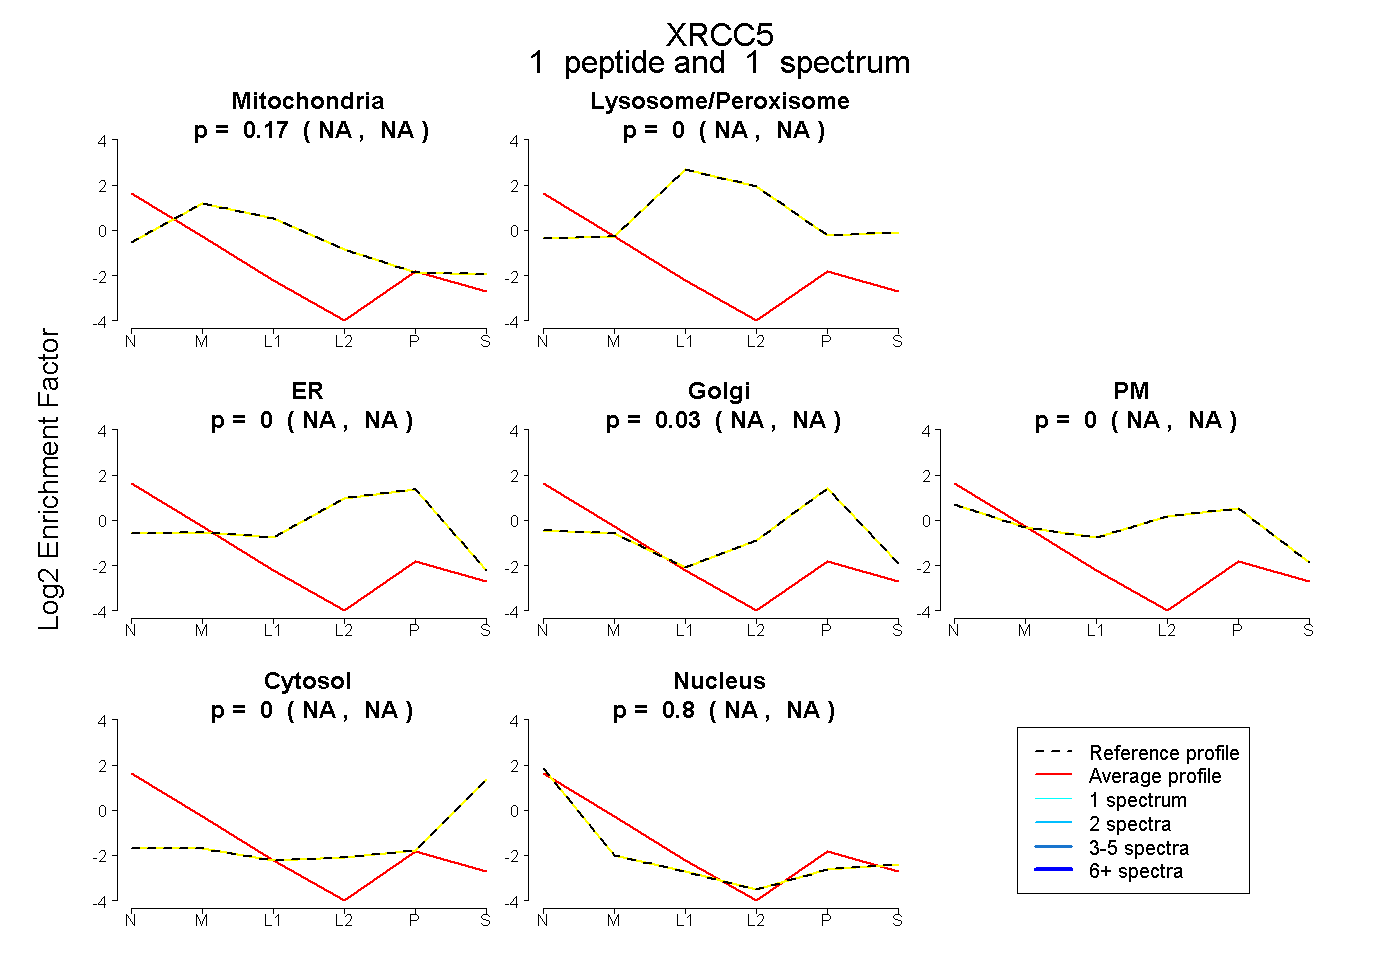
| Plot | Mito | Lyso or Perox | ER | Golgi | PM | Cytosol | Nucleus | ||||||
| Expt B |
1 peptide |
1 spectrum |
|
0.171 NA | NA |
0.000 NA | NA |
0.000 NA | NA |
0.034 NA | NA |
0.000 NA | NA |
0.000 NA | NA |
0.795 NA | NA |