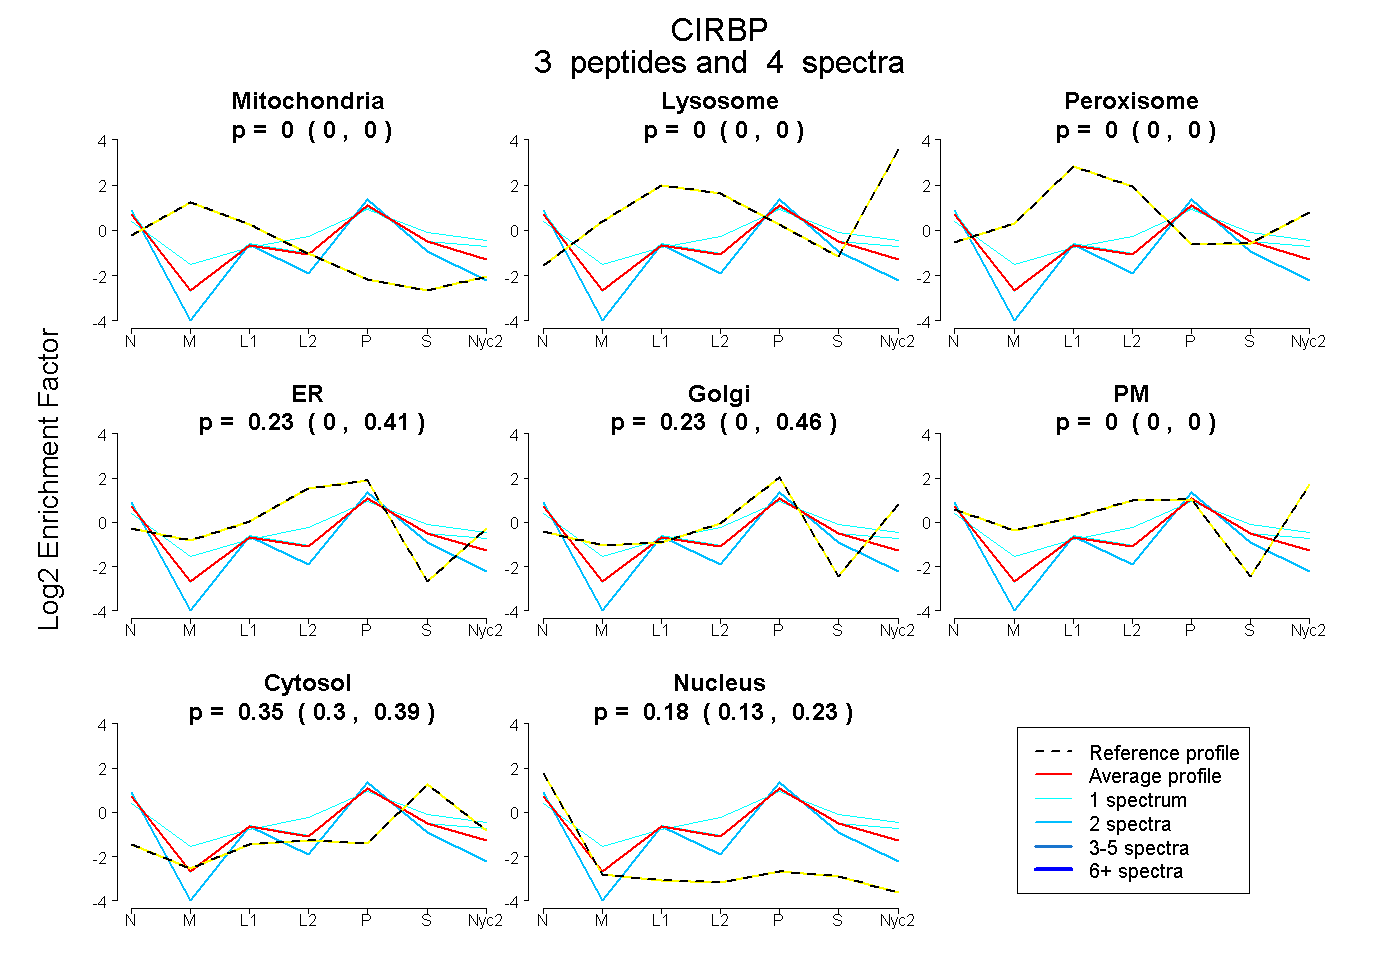
 3
3peptides
spectra
0.000 | 0.000
0.000 | 0.000
0.000 | 0.000
0.000 | 0.411
0.000 | 0.461
0.000 | 0.000
0.296 | 0.391
0.127 | 0.226
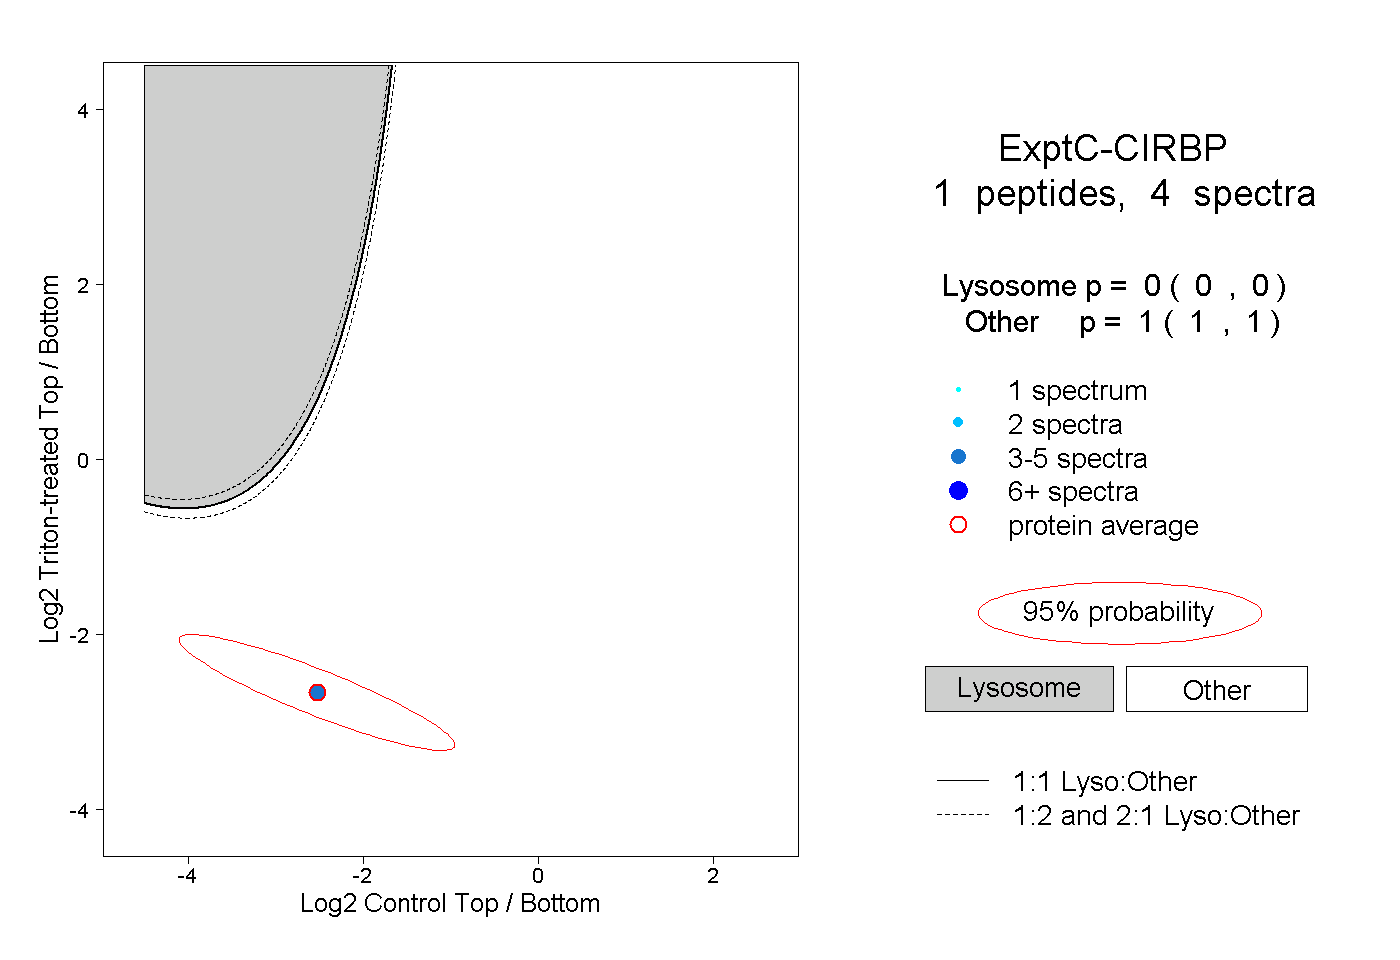
1peptide
spectra
0.000 | 0.000
1.000 | 1.000
| Plot | Mito | Lyso | Perox | ER | Golgi | PM | Cytosol | Nucleus | |||||
| Expt A |
3 peptides |
4 spectra |
|
0.000 0.000 | 0.000 |
0.000 0.000 | 0.000 |
0.000 0.000 | 0.000 |
0.234 0.000 | 0.411 |
0.234 0.000 | 0.461 |
0.000 0.000 | 0.000 |
0.351 0.296 | 0.391 |
0.181 0.127 | 0.226 |
||
| Plot | Lyso | Other | |||||||||||
| Expt C |
1 peptide |
4 spectra |
|
0.000 0.000 | 0.000 |
1.000 1.000 | 1.000 |